ViewPoint EchoPilot - AI Software for Echocardiography
Model Version: v2
Revision: E
Medical Device


Table of Contents
1 Introduction
This document is the user guide for ViewPoint EchoPilot , a Software as a Medical Device licensed by GE Healthcare. It is recommended that you read this instruction manual carefully before use.
ViewPoint EchoPilot is a clinical decision support tool that analyzes echocardiogram images in order to generate a series of AI derived measurements. Fully automated, functional reporting with disease indications are also provided, in line with ASE & ESC guidelines.
Echo images are sent to the ViewPoint EchoPilot platform where they are processed, analyzed and measured. Results that meet the confidence threshold for both image quality and measurement accuracy are passed through to a report for review by the clinical users. Report text is also generated and presented with the measurements, providing functional reporting and disease indications.
ViewPoint EchoPilot greatly reduces user time spent creating manual measurements and allows clinical users to prioritize quality image acquisition and clinical time with patients.
Benefits
- No limitation on the number of users or echo scanner connections, with simple per exam pricing.
- ViewPoint EchoPilot processes DICOM image data and produces measurements in ~2 minutes.
- Removes/reduces the need for clinical staff to spend time measuring, increasing efficiency and throughput of patients.
- Eliminates operator variability, providing more accurate and consistent results than humans.
- Custom measurements can be made using the intuitive user interface.
- Image viewer is integrated into the web application and linked to the measurements, which makes reviewing images and measurements a single click.
- Results and measurements can be sent to EHR, PACS, CVIS as discrete measurements (HL7, CSV, DICOM SR, Encapsulated PDF) or stored as a formatted PDF report for review/signature/approval.
- All data is standardized and structured in a single DICOM SR format regardless of the source echo machine.
1.1 Abbreviations
A: area
A2C: Apical 2-chamber
A3C: Apical 3-chamber
A4C: Apical 4-chamber
A5C: Apical 2-chamber
A-L: Area-Length
Ao: Aorta
AV: Aortic Valve
CO: Cardiac Output
CW: Continuous-Wave
d: diastole
DecT: Deceleration Time
i: indexed for body surface area
ID: Internal Diameter
Echo: Echocardiogram
EDV: End-Diastolic Volume
EF: Ejection Fraction
ESV: End-Systolic Volume
IVS: Inter-Ventricular Septal
L: Length
LV: Left Ventricular
MOD: Method of Discs
MV: Mitral Valve
OT: Outflow Tract
PLAX: Parasternal Long Axis
Pmax: Maximum Pressure gradient
PW: Posterior Wall
RA: Right Atrium
RV: Right Ventricle
RWT: Relative Wall thickness
RWMA: Regional Wall Motion Abnormality
s: systole
TAPSE: Tricuspid Annular Plane Systolic Excursion
TR: Tricuspid Regurgitation
Vmax: Maximum Velocity
W: Width
1.2 Intended Use
This software is used to process acquired transthoracic cardiac ultrasound images, to analyze and make measurements on images in order to provide automated estimation of several cardiac structural and functional parameters, including left/ right atrial and ventricular linear dimensions, volumes, systolic function and diastolic function, measured by B mode, M mode and Doppler (PW, CW, tissue) modalities. The data produced by this software is intended to be used to support qualified cardiologists, sonographers, or other licensed professional healthcare practitioners for clinical decision-making. The software is indicated for use in adult patients.
1.3 Contraindications and Limitations
Because ViewPoint EchoPilot measurements cover the minimum echocardiographic dataset for a standard adult echocardiogram (by European Society of Cardiovascular Imaging, British Society of Echocardiography and American Society of Echocardiography guidelines), our software is applicable to the vast majority of adult transthoracic echocardiograms.
Our current software aims to automate measurements of cardiac dimensions and left ventricular function and are applicable regardless of normal or disease states. We specifically indicate that our current product will not be reporting measurements associated with intra-cardiac lesions (e.g. tumours, thrombi), nor complex adult congenital heart disease.
Please note the following additional limitations:
- Poor image capture will lead to poor annotations and subsequent measurements. Multiple image quality algorithms are used to filter out images of poor quality.
- Our software complements good patient care and does not exempt the user from the responsibility to provide supervision, clinically review the patient, and make appropriate clinical decisions.
- If no gender is present, female referenced guideline values will be used for conclusions.
- If Body Surface Area (BSA) is not present, indexed values cannot be provided.
- Normal reference values vary with age, sex, and In case of doubt always refer back to the appropriate cardiac society's guidelines.
- During image acquisition, inappropriate use of the echo machine, use of non- cardiac ultrasound probes, use of suboptimal settings (e.g. gain, contrast, depth), or lack of EKG capture may lead to lower accuracy of the software.
- ViewPoint EchoPilot does not identify regions of interest or areas of possible pathology in the images.
- ViewPoint EchoPilot does not differentiate different types of Cardiac Amyloidosis e.g. ATTR, AL etc.
- ViewPoint EchoPilot was externally validated on cardiac images from GE and Philips ultrasound systems. Use of the device on ultrasound systems other than GE and Philips may lead to lower accuracy of the software.
1.4 Clinical Benefits
ViewPoint EchoPilot is an image post-processing analysis software device used for viewing and quantifying cardiovascular ultrasound images in DICOM format. The device is intended to aid diagnostic review and analysis of echocardiographic data, patient record management and reporting.
The primary intended function of ViewPoint EchoPilot is to automatically provide clinically relevant and reproducible quantitative echocardiographic measurements, while reducing echocardiographic analysis time. In doing so, the primary benefit of ViewPoint EchoPilot is to improve clinical echocardiographic workflow, enabling clinicians to generate and edit reports faster, with precision and with full control.
Today, the clinical workflow of a sonographer is as follows:
- The sonographer performs the echocardiography exam (“echo exam”) to capture the images/videos.
- The specialist sends the images/videos to a server for picture archiving and communication system (PACS).
- Another specialist retrieves the images/videos from the PACS and downloads them onto a local workstation to then:
- Review the images/videos. Manually determine which view has been captured.
- Manually determine the cardiac structures imaged within the captured view.
- Manually segment and draw annotations on the region of interest (ROI) in order to perform measurements.
- Manually refer to standard reference guidelines to determine if any of the potentially dozens of measurements performed fall within the normal range of values for that patient’s sex or ethnicity.
- Manually create a report based upon the conclusions drawn from the measurements.
This process can be prone to human error, and is more importantly time-consuming, placing a rate on the number of exams that can be processed within a given unit of time.
The goal of ViewPoint EchoPilot is to simplify much of this process through machine learning based automation, so that the workflow becomes:
- The sonographer performs the echo
- The sonographer sends the images/videos to a PACS
- ViewPoint EchoPilot retrieves the images/videos from the PACS and processes them, allowing a sonographer to then:
- Review the report which has already highlighted measurements that fall outside of normal ranges.
- Review the original images/videos, if desired.
- Manually adjust any of the automated segmentations and measurements if desired.
1.4.1 Enhanced Echocardiographic Reporting: Balancing Automated Analysis with Manual Review
While the software does not require human intervention to automatically produce a full report, the software provides an interface for a skilled sonographer/ reviewing physician to perform edits/ revise the markup on the echocardiographic image measurement if needed. The markup includes: the cardiac segments captured, measurements of distance, time, area and blood flow, quantitative analysis of cardiac function, and a summary report.
The software allows the sonographer to enter their markup manually. It also provides automated markup and analysis, which the sonographer may choose to accept outright, to accept partially and modify, or to reject and ignore. Machine learning based view classification and border detection form the basis for this automated analysis. Additionally, the software has features for organizing, displaying and comparing to reference guidelines the quantitative data from cardiovascular images acquired from ultrasound scanners.
2 Regulatory compliance and maintenance
2.1 Licensing
ViewPoint EchoPilot is purchased and licensed as a simple SaaS subscription with a per exam fee, after installation and training. Professional licenses are based on the number of echo scanners connected, whereas Enterprise licenses offer unlimited scanner connections. Both options allow for unlimited client (user) connections. Initial setup costs depend on the complexity and hours of professional services required, please request a formal quotation from your local representative.
Usage of this device is governed by respective regulatory clearances. For detailed information please contact your local representative.
2.1.1 Monitoring and tracking
ViewPoint EchoPilot requires remote access to manage licensing, monitor usage, and provide application technical support. ConnectWise ScreenConnect is the preferred remote access tool for support. Details for alternative remote access to be agreed with the local IT administration team.
2.2 Compliant Use
The use of this device is reserved for qualified cardiologists or licensed primary care providers for clinical decision-making. Any inappropriate use is forbidden.
2.3 Malfunction
In case of malfunction:
- Immediately stop using the device.
- Refresh the web browser.
- If it is not possible to identify or eliminate the cause using this document, switch the device off and contact ViewPoint EchoPilot (see Manufacturer section at the end of this document).
- Any serious incident that has occurred in relation to the device should be reported to the manufacturer, licensor and the competent authority of the Member State in which the user and/or patient is established.
3 Installation
ViewPoint EchoPilot is available as a cloud service, installed on premises (hard server or suitable VM), or on a high end tablet, laptop or workstation, for direct connected offline use. Workflows are fully configurable, the software can be interfaced and integrated with any combination of echo scanners and PACS/EMR/reporting packages.
ViewPoint EchoPilot comes in two configurations:
3.1 Cloud workflows
Images can be sent to our cloud application directly with DICOM TLS or via the ViewPoint EchoPilot DICOM Router installed on a local server or workstation.
Browser requirements: The ViewPoint EchoPilot client application is specified for use with version 93+ of chromium through Edge, Chrome and Brave. A minimum of 4GB of RAM is recommended.
3.1.1 DICOM send via TLS
The ViewPoint EchoPilot provides a secure interface for securely exchanging data between echocardiography machines and the ViewPoint EchoPilot cloud platform using TLS encryption. Follow the steps below to configure PACS (TLS) integration:
- Navigate to PACS Configuration:
- Open the ViewPoint EchoPilot and go to Settings → Workflow Integration → PACS Config (TLS).
- Enable PACS Communication:
Ensure the following toggles are turned on:
- Enable PACS (TLS)
- Whitelist Sending AE Title (SCU)
- Whitelist SCU AE Titles:
- To authorize DICOM communication, enter the SCU AE Title(s) for any connected echocardiography machines. Make sure the corresponding checkboxes are selected to activate each entry.
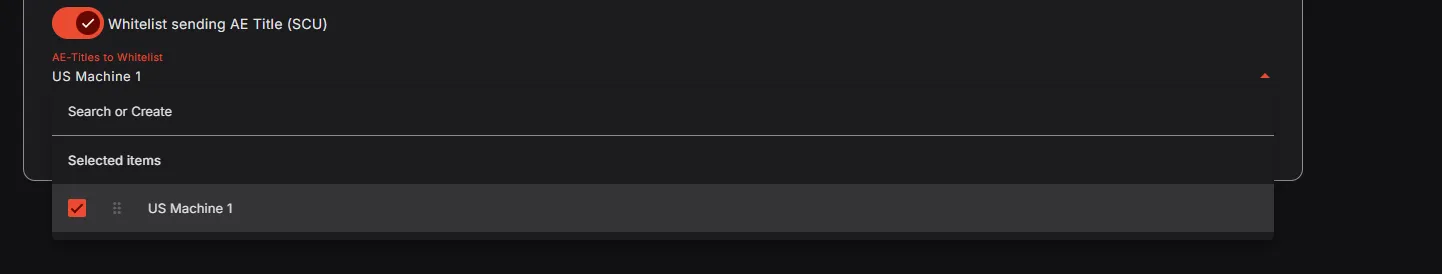
- To authorize DICOM communication, enter the SCU AE Title(s) for any connected echocardiography machines. Make sure the corresponding checkboxes are selected to activate each entry.
- Save Configuration:
- Once complete, click Save Changes to apply the new configuration. A confirmation message “Config saved successfully… Close” will appear at the bottom of the page.
- Record PACS Destination Details:
Note the SCP (Cloud PACS) details displayed. These must be entered as the DICOM destination on each SCU (Echo machine). The required information includes:
- EchoPilot Host IP Address or Domain (there are two IP addresses displayed, use either): Example: 18.198.159.253 or 3.75.118.187
- EchoPilot Port: 11113
- EchoPilot AE Title: Example: JUM_12527199
- (Optional) Server Certificate:
If required by your echocardiography machines, download the server certificate and import it to enable secure TLS communication.
3.1.2 DICOM send and receive via DICOM router
The ViewPoint EchoPilot DICOM router is a software solution designed to securely exchange data between echocardiography machines, PACS systems, and the ViewPoint EchoPilot cloud platform. It offers several key features:
- Bi-directional communication: The router can send and receive DICOM data (images, structured reports, PDFs) as well as HL7 messages (electronic health records format) between your local network and the ViewPoint EchoPilot cloud.
- Outbound:
- Send DICOM images with AI-generated measurements overlaid.
- Transmit DICOM structured reports (measurements and text data).
- Forward DICOM PDF reports or HL7 messages to your local PACS or EMR system.
- Inbound:
- Receive results (reports) from the ViewPoint EchoPilot cloud and forward them to your local network.
- Security:
- The router provides anonymization and encryption services prior to upload, acting as a single point of exit, allowing multiple echo scanners or PACS servers to securely communicate data bi-directionally with the ViewPoint EchoPilot cloud, which is hosted in AWS.
- Flexibility:
- Outbound-only mode: For networks with restricted internet access, the router isolates echo machines from the internet while still allowing data exchange with ViewPoint EchoPilot .
- User-configurable settings: Manage settings directly within the ViewPoint EchoPilot application after initial setup with ViewPoint EchoPilot support.
The ViewPoint EchoPilot DICOM router removes the need for a VPN while offering benefits such as monitoring, logging and flexible configurations to fit customer workflows. However, it's important to consider potential PACS incompatibility with MP4 compression as it greatly reduce the file sizes prior to upload. If source DICOM images are required to be exported from ViewPoint EchoPilot in the future, please request that this is disabled on installation (i.e., if the ViewPoint EchoPilot cloud application is your primary image storage). In most cases, source DICOM images have already been sent to a PACS and will not need to be exported from ViewPoint EchoPilot .
3.1.2.1 Requirements
The DICOM router can be installed on a workstation or server on the users network, and must be reachable by all echo machines and PACS servers that will send or receive data.
Minimum specification:
- 4GB RAM, 1 Core CPU.
- Windows 10 or higher (for Linux distributions please contact your ViewPoint EchoPilot representative with your request)
- Static IP address
- Internet facing with open ports:
- inbound 11113
- outbound 443
- plus any ports used to send to onsite PACS/EMR (defined by the PACS manager)
- Remote access by ViewPoint EchoPilot staff is required for specialized configurations, which can be supervised access only
3.1.2.2 Installation
To setup the DICOM router, follow the steps below:
Installer setup (Windows)
- Download through the app from the profile menu
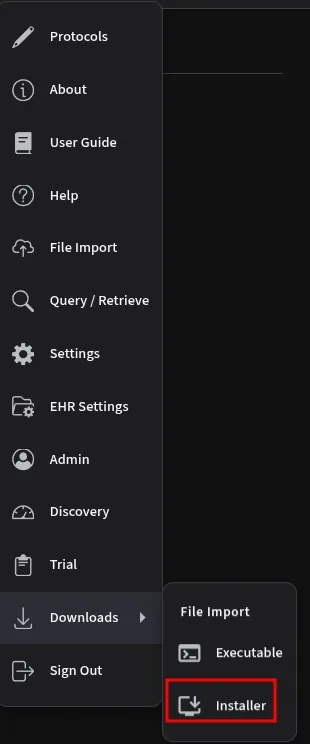
- Run the installer executable
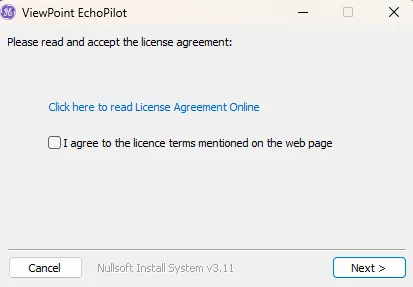
- Accept license agreement
- Type in ViewPoint EchoPilot username/password
- Note here an API key can also be used by using
__token__for the username and pasting the API key created on the settings page
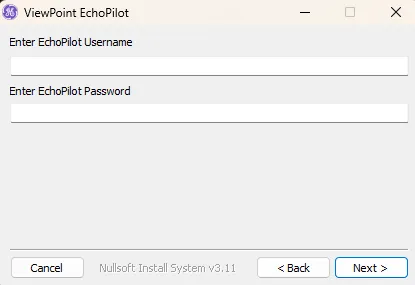
- Note here an API key can also be used by using
- Select installation folder and hit install
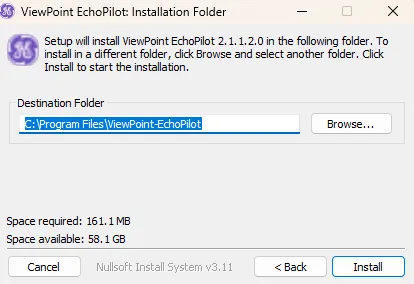
- The EchoPilot Upload should now be installed and running under the name
ViewPoint EchoPilot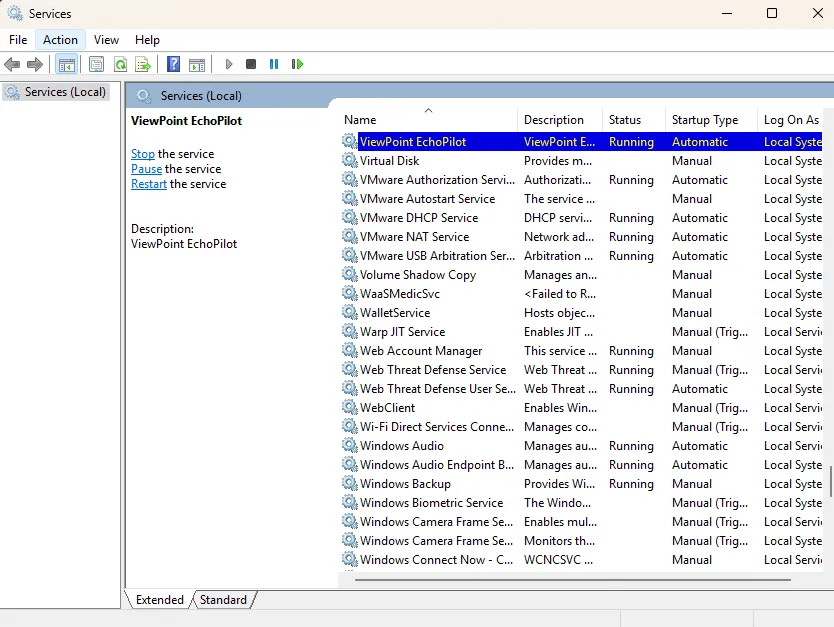
Manual setup
- Download the latest version of the DICOM router here
- In your home folder, create a new directory
echopilot - Place the downloaded DICOM router executable file in this directory
- Create a
run.batscript in theechopilotfolder, with the following contents (replace<username>and<password>with credentials used for the ViewPoint EchoPilot app )
CALL echopilot.exe --app-config --username <username> --password <password>- To setup the router as a service on the machine, follow the steps below:
- Download nssm and place the file in the
echopilotfolder - Open a PowerShell in the
echopilotfolder - Run the following command
.\nssm.exe install echopilot <folder>\echopilot\run.bat- Replace
<folder>with the location of theechopilotfolder
- Replace
- The EchoPilot Upload service should now appear in the windows service dialog
- Right click the service and click start
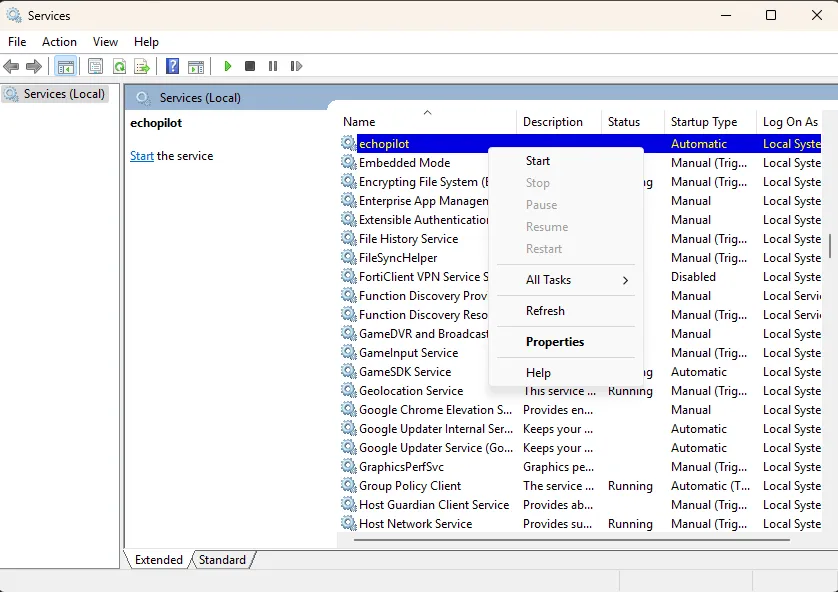
- Download nssm and place the file in the
- The DICOM router software is now running as a DICOM SCP and can be set as a DICOM server destination on echo machines and PACS servers:
- The following details will be entered as a DICOM server on the echo machines:
- IP address of Server hosting the ViewPoint EchoPilot application
- AE Title: echopilot
- Port: 11112
- Set the echo machines to export 30 frames per second or greater (full frame rate is preferred for stress analysis)
- JPEG compression can be used
- DICOM SR can be sent to ViewPoint EchoPilot if user generated measurements are also to be viewed within the ViewPoint EchoPilot application
3.2 GE Systems
There are two USB export modes with GE Vivid systems, please ensure you are using the Dicom USB for transfer, not the USB Archive.
- Dicom USB (or Dicom USB Harddisk/Memstick) - Dicom multiframe.
This option is hidden as a default & needs enabling in the Vivid config. Go to Config, Connectivity, Dataflows, Select Dicom USB from the Dataflow dropdown, untick “Hidden”. Use this transfer option for export & manual upload to ViewPoint EchoPilot .
- USB Archive (or USB Harddisk/Memstick) - Single Dicom frame only, with GE RAW data stored in private tags - Do not use this for export to ViewPoint EchoPilot .
Installation instructions: installation may be only realized by technicians of ViewPoint EchoPilot .
4 Getting Started
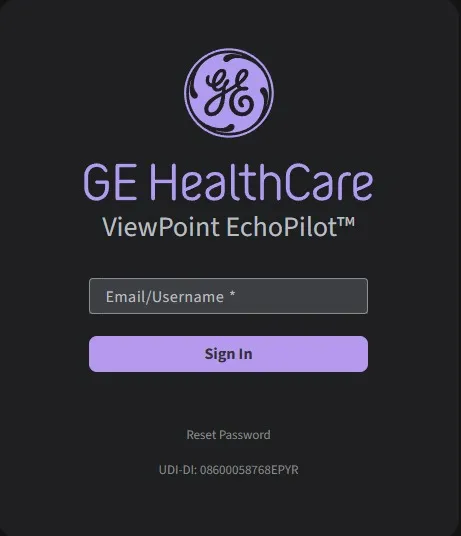
4.1 Login
Using your user login credentials that you will have received separately, use your browser and navigate to http://app.viewpoint-echopilot.ai to login.
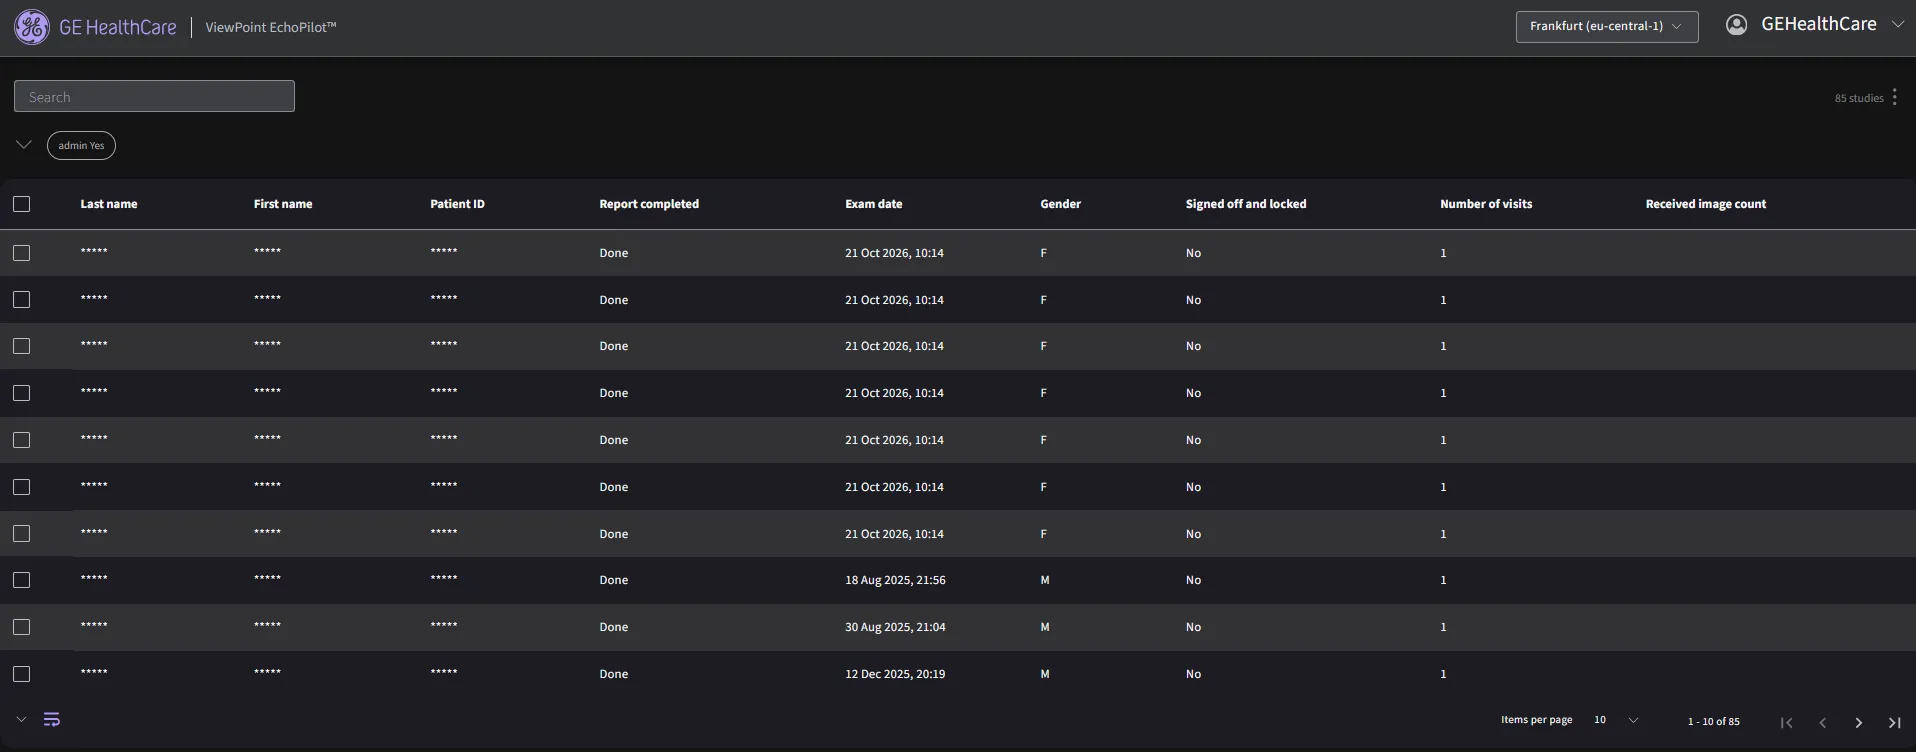
At the ‘Search page’ is where you can find all of your most recently received studies.
Once logged in, click your username in the top right corner of the app to open the user menu

User settings for your account may be customized through the ‘Settings’ option in the drop down.

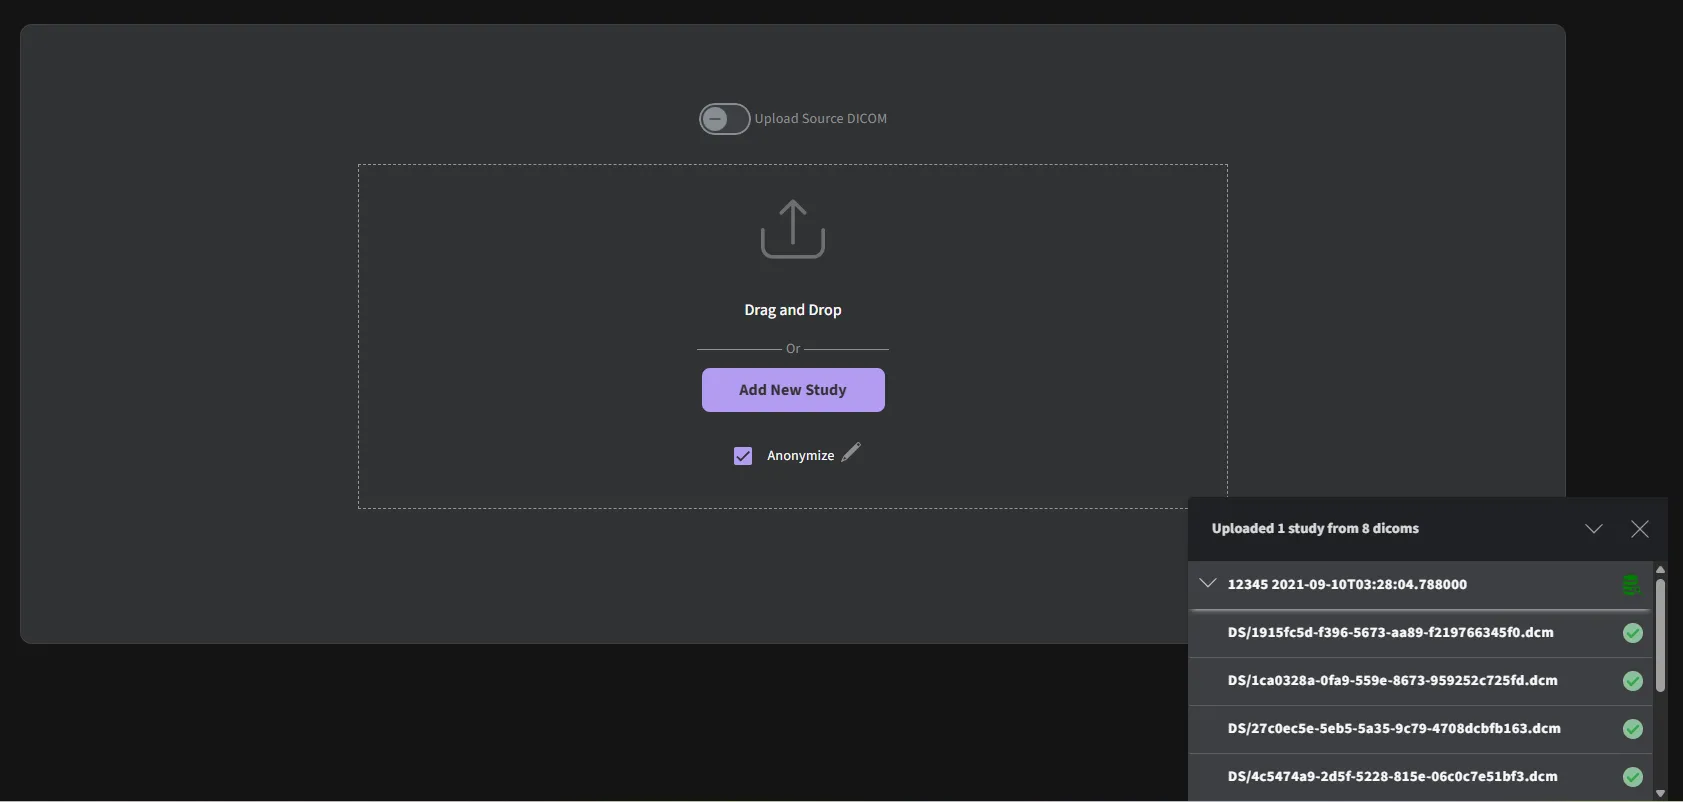
4.2 File Import
- Select the "File Import" option. Note only DICOM format studies are supported.

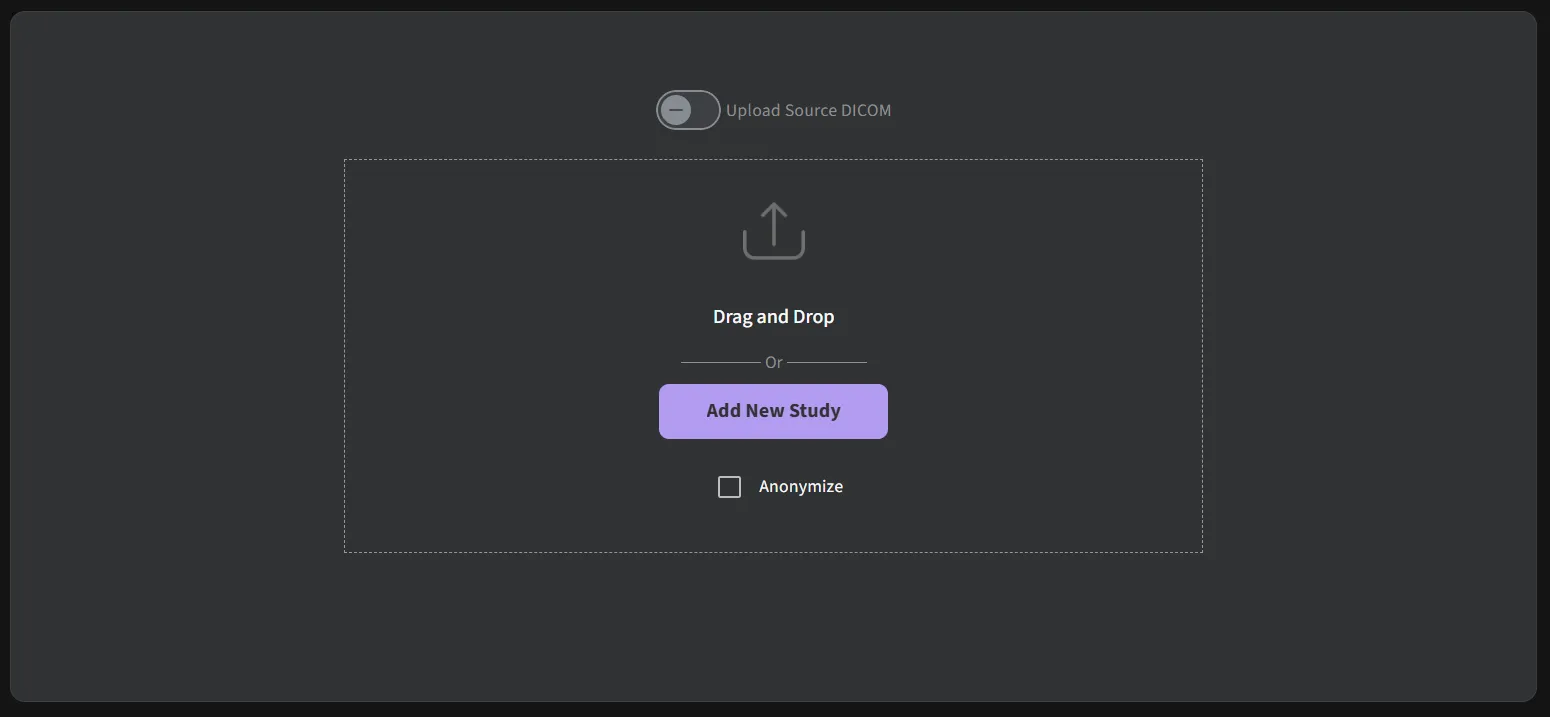
- Click on Browse Files to locate the echo studies you would like to analyze, or simply drag and drop them into the browser window.
- Click the Anonymize checkbox to remove patient identifiers from the processed files.
- Once your files have been added, you will be given the chance to approve them before they are processed (in the cloud or on premises). The original DICOM files are stripped of the majority of their information, images cropped to remove any potential identifiers, and DICOM metatags removed, except for those required by the software.
- The following DICOM metatags are always used:
- AccessionNumber
- AcquisitionDate
- AcquisitionDateTime
- AcquisitionTime
- ClinicalTrialProtocolID
- ClinicalTrialProtocolName
- ClinicalTrialSubjectID
- ContentDate
- ContentTime
- InstanceNumber
- InstitutionName
- Manufacturer
- ManufacturerModelName
- Modality
- PatientAge
- PatientSex
- PatientSize
- PatientWeight
- ReadingPhysician
- ReferringPhysician
- SeriesDate
- SeriesInstanceUID
- SeriesNumber
- SOPClassUID
- SOPInstanceUID
- StudyDate
- StudyDescription
- StudyID
- StudyInstanceUID
- StudyTime
- ViewNumber
- ViewName
- TransferSyntaxUID
- StageNumber
- StageName
- SequenceOfUltrasoundRegions
- SegmentedRedPaletteColorLookupTableData
- SegmentedGreenPaletteColorLookupTableData
- SegmentedBluePaletteColorLookupTableData
- SamplesPerPixel
- Rows
- RedPaletteColorLookupTableDescriptor
- RedPaletteColorLookupTableData
- RecommendedDisplayFrameRate
- PlanarConfiguration
- PixelRepresentation
- PhotometricInterpretation
- NumberOfStages
- NumberOfFrames
- HighBit
- HeartRate
- GreenPaletteColorLookupTableDescriptor
- GreenPaletteColorLookupTableData
- FrameTime
- EffectiveDuration
- Columns
- CineRate
- BluePaletteColorLookupTableDescriptor
- BluePaletteColorLookupTableData
- BitsStored
- BitsAllocated
- The following DICOM metatags are used when anonymization is turned off:
- PatientBirthDate
- PatientID
- PatientName
Prior to uploading, you will be able to remove, pseudonymize for each of the respective metatags by clicking on the ‘Edit’ button beside the Anonymize checkbox.

You may customize the DICOM tags to be anonymized during the upload process. The dialog box will appear and you will be able to select whether to Remove/Pseudonymize/Keep a particular metatag. Pseudonymization is to apply a hash to the Patient ID where ViewPoint EchoPilot may be able to determine based on the original. Your selection will be saved for future uploads.
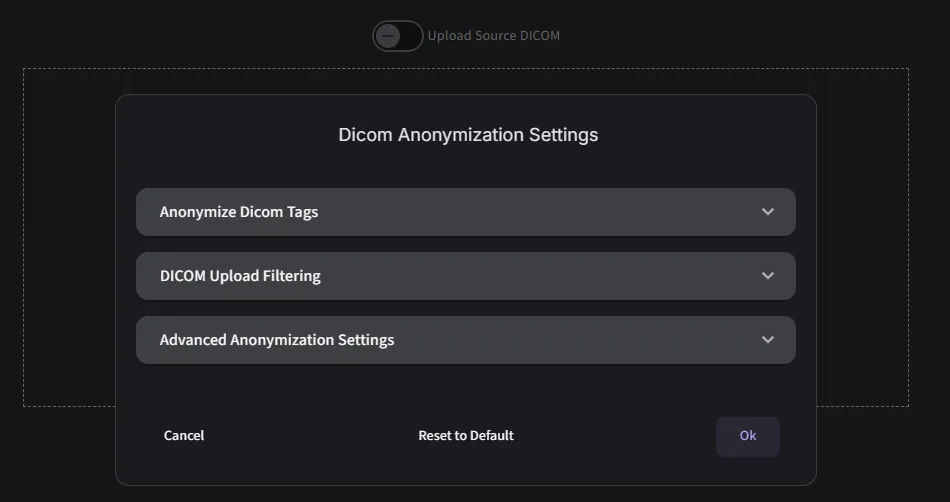
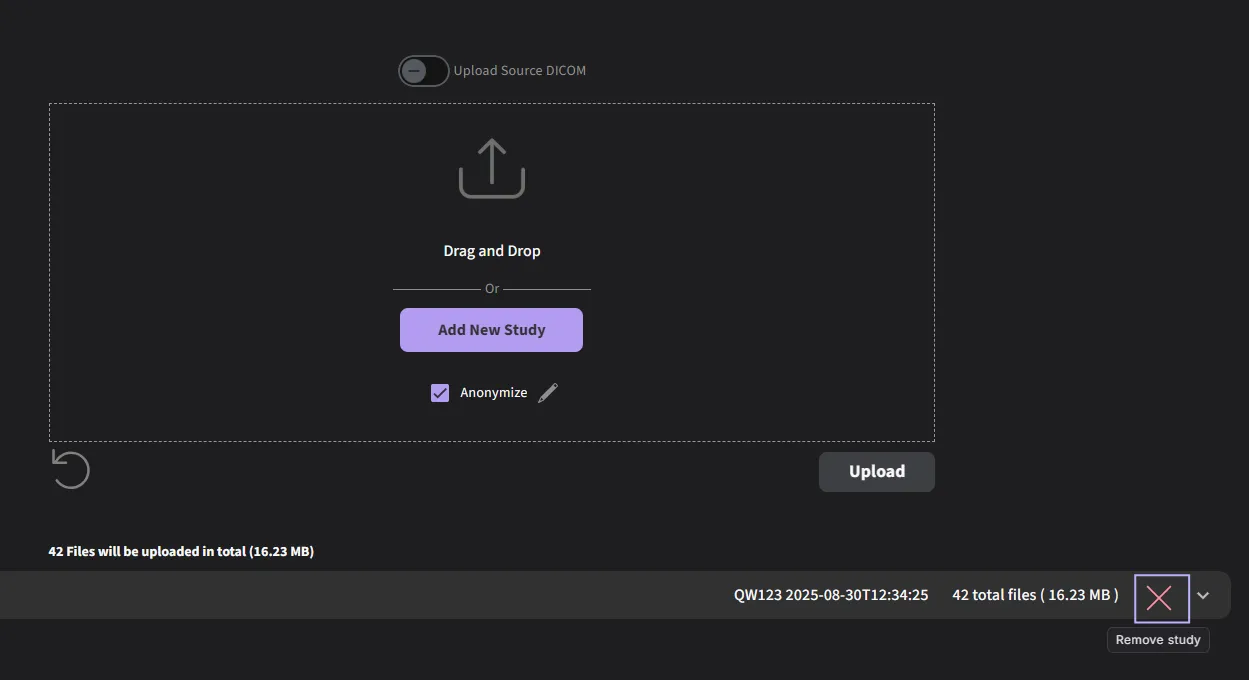
Individual DICOMS can be removed from the upload.
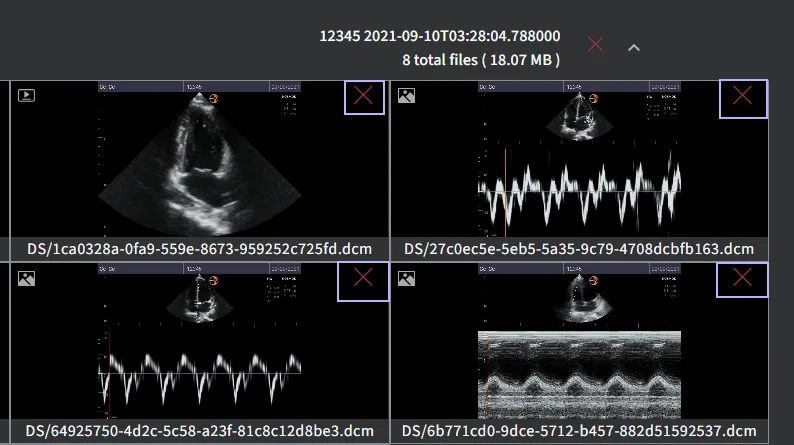
During the uploading process, you should see a screen like the one below.
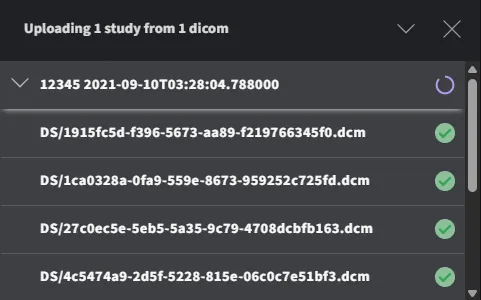
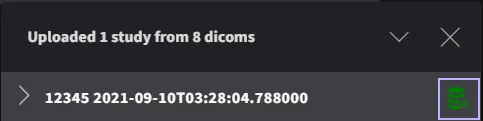
Once the upload is completed, you can click “View study” to review.
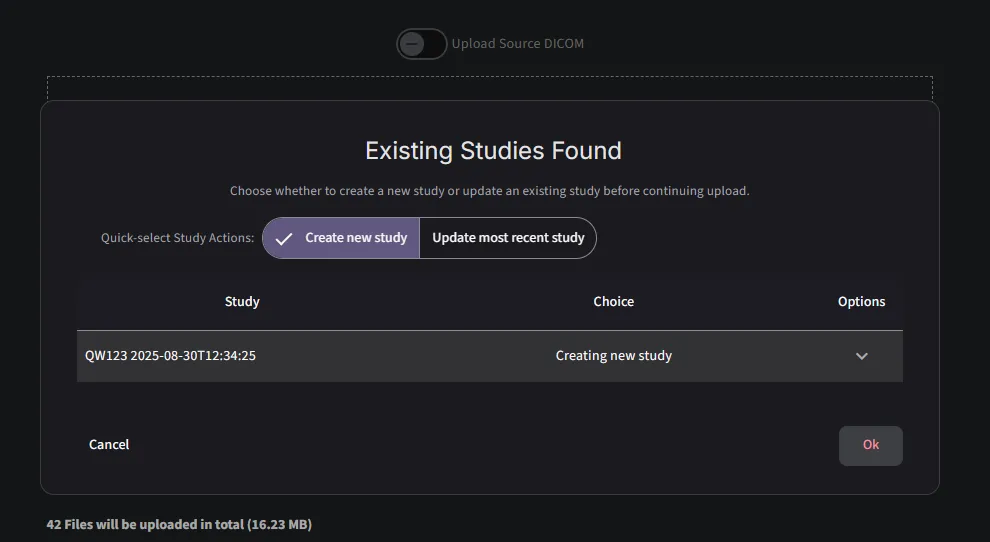
When an existing exam is found during the upload process, a notification will prompt the user to either create a new exam or update the existing one.
Uploads can be removed using the ‘Reset’ button. After you have approved the images, the upload will start following a predefined workflow based on the mode of installation.
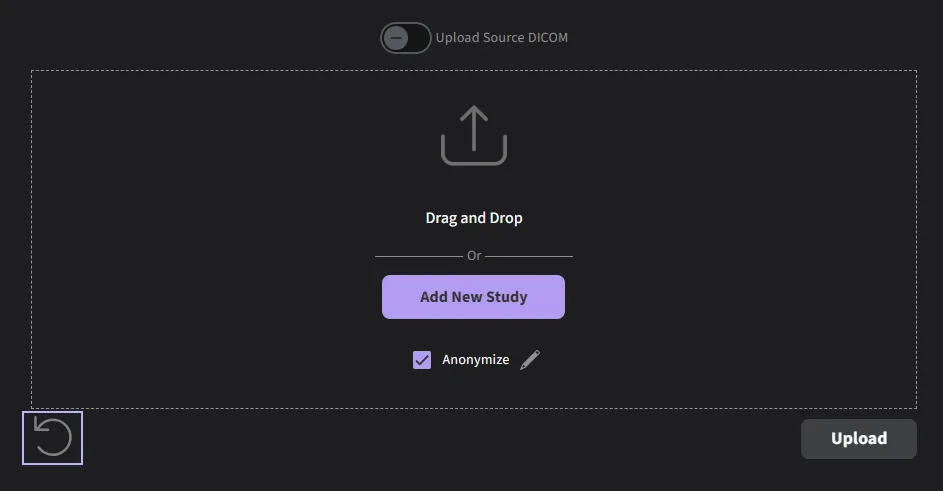
After you have approved the images, the upload will start following a predefined workflow based on the mode of installation.
- Cloud: A pre-signed URL will be created and used to upload to the AWS s3 bucket
- On-Prem: Upload will be performed directly to an upload URL
Upon completion of the upload, the automated analysis will be triggered based on the uploaded DICOM images and reflected on the search page as the processing finalizes.
Echos must be in the standard DICOM format and can be loaded from your local computer or a network For connections to a PACs server or custom EHR integrations, please contact ViewPoint EchoPilot (see Manufacturer section at the end of this document)
4.3 Searching for patient studies
Once you have loaded DICOM files into ViewPoint EchoPilot app with the EchoPilot Upload module, the echos will automatically be processed and visible on the web app, confirming the device is properly installed.
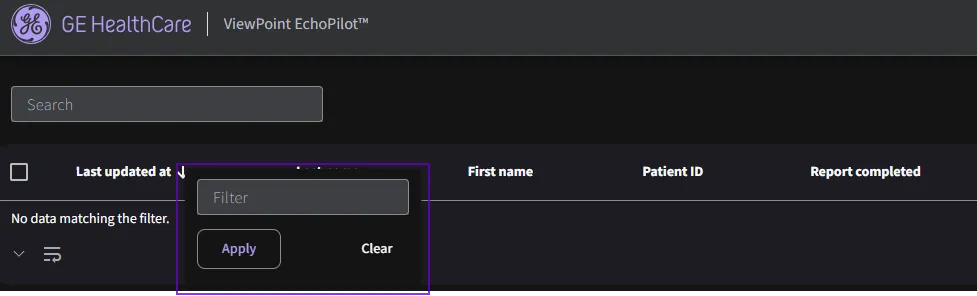
The patient study search page now supports two ways to filter results: the existing Simple/Advanced Search, and column-level filters accessed directly in the results table.
4.3.1 Column-level filter option
- When viewing the patient study search results, move the cursor to the header of the column you want to filter (for example, Exam date, Trial, or Patient ID).
- Right‑click on the column header to open the table filter options, then specify the filter values (such as equals, contains, before/after a date) to narrow the list of studies.
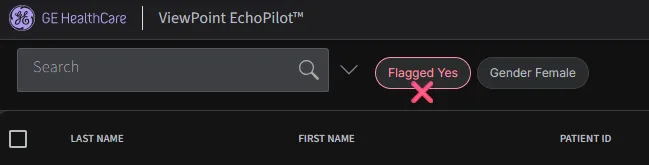
4.3.2 Simple/Advanced Search filter option
- Use Simple Search Tools at the top of the page to search by identifiers and common attributes, such as last name, first name, patient ID, date of birth, exam date, trial, approved/completed reports, flagged studies, and similar fields.
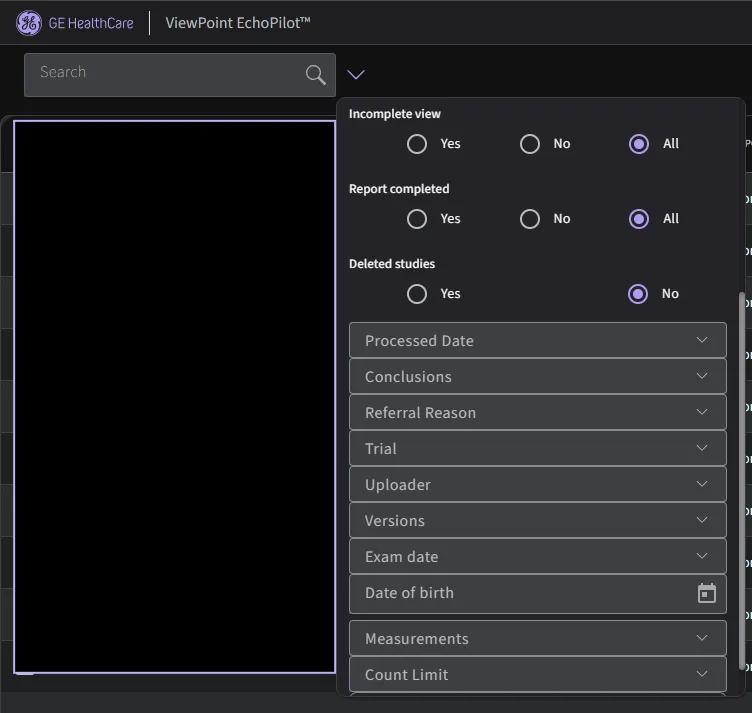
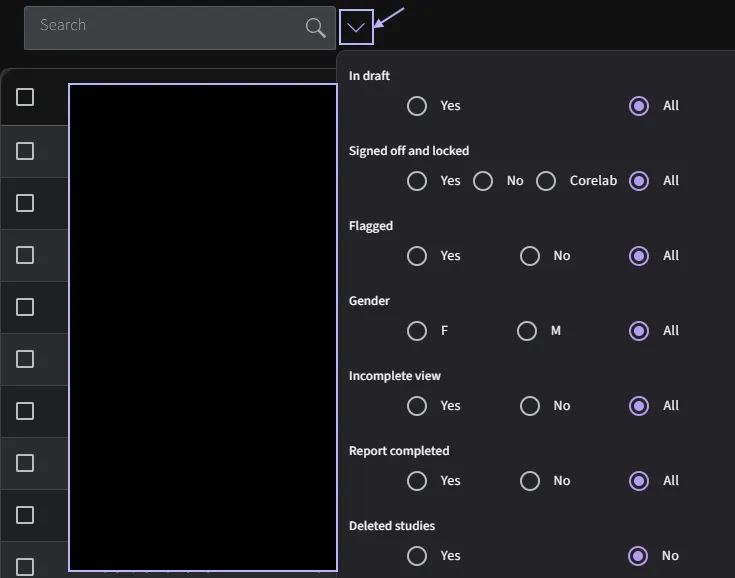
- Open the Advanced Search Tools panel to filter by clinical and report parameters, such as conclusions, LV and RV function/size, atrial size, heart failure, pulmonary hypertension, referral reason, LVEF, and LV E/e’.
More Advanced Search Tools are also available to locate studies by specified search criteria. You can search for studies using:
- Conclusions
- LV Systolic Function
- LV Diastolic Function
- LV Size
- LV Geometry
- RV Function
- RV Size
- LA Size
- RA Size
- Aortic Stenosis
- Pulmonary Hypertension
- Heart Failure
- Cardiac Amyloidosis
- Referral reason
- Trial (if applicable)
- Measurements
Radio buttons, toggles, text entry fields, dropdown selectors and date pickers are implemented using their respective Angular Material components. The Advanced Search options are contained within an Angular Material expansion panel.
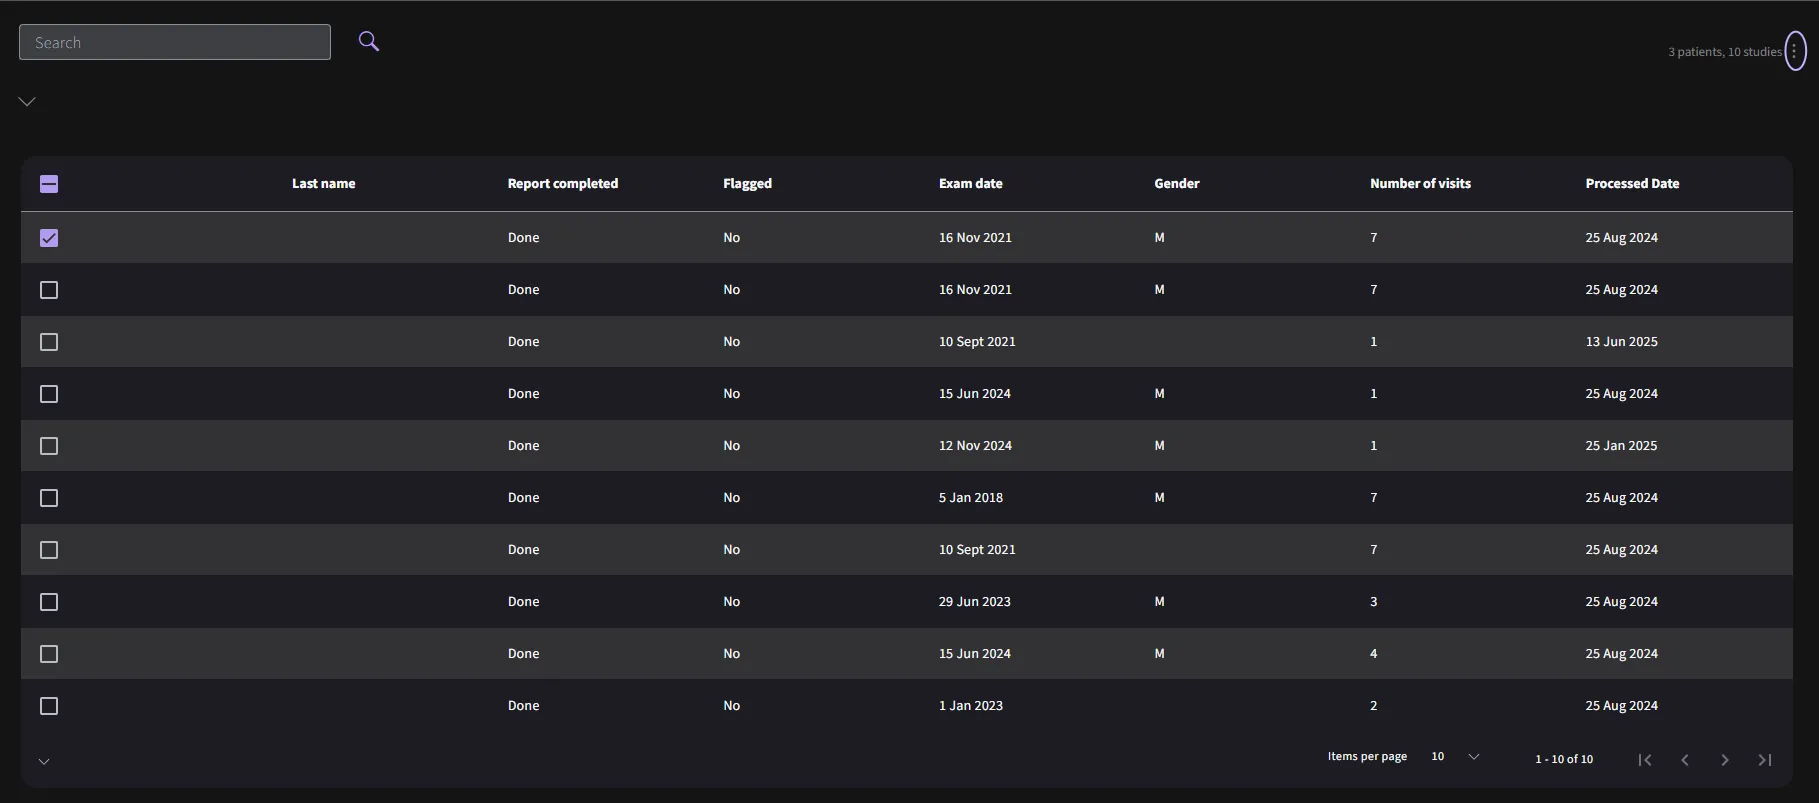
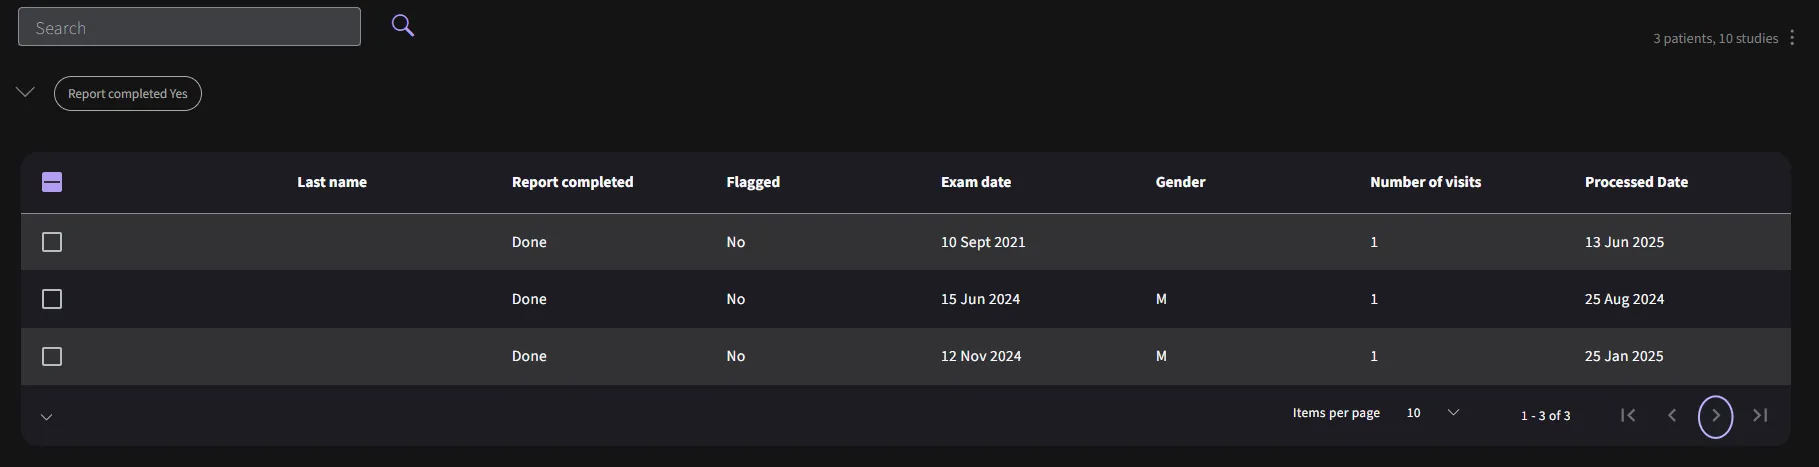
The search page also offers a paginated search result overview, that allows the user to navigate to any report that matches their search criteria.
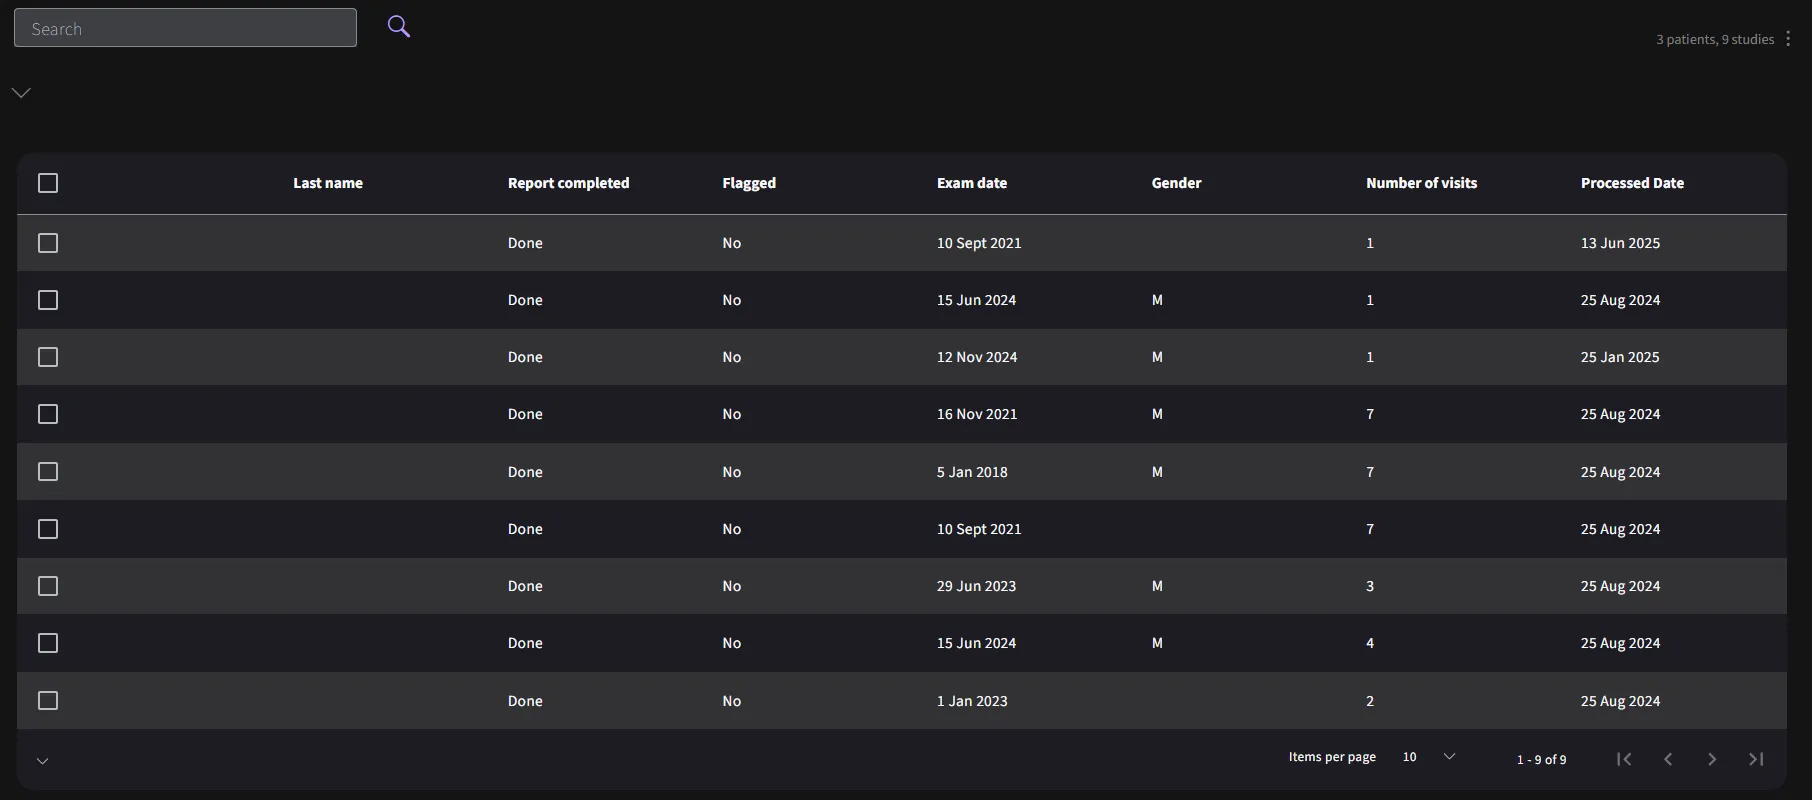
Reports can be selected for any of the above actions. Searches can be saved for future use and reloaded as needed.
If you wish to view the full list of studies, you can clear all default filters. This will reset the filter settings and allow you to access the complete study database.
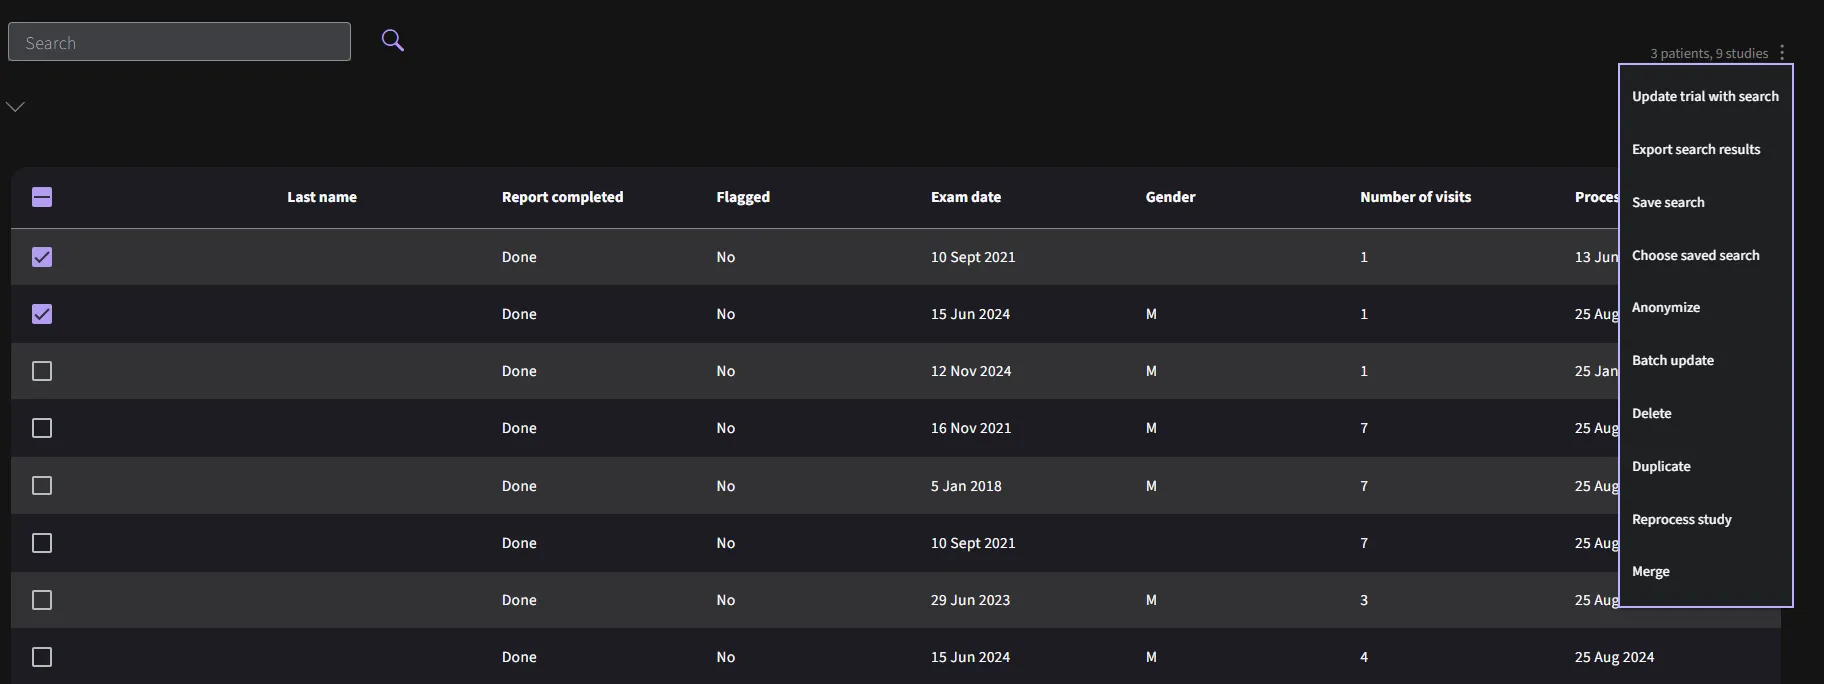
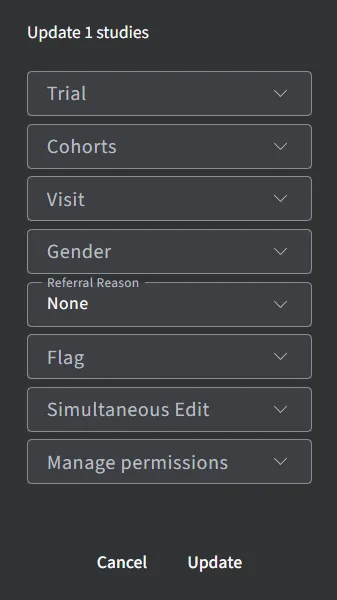
The following properties can be updated with the batch update tool.
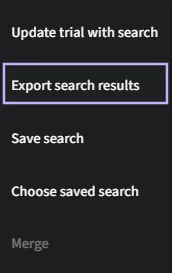
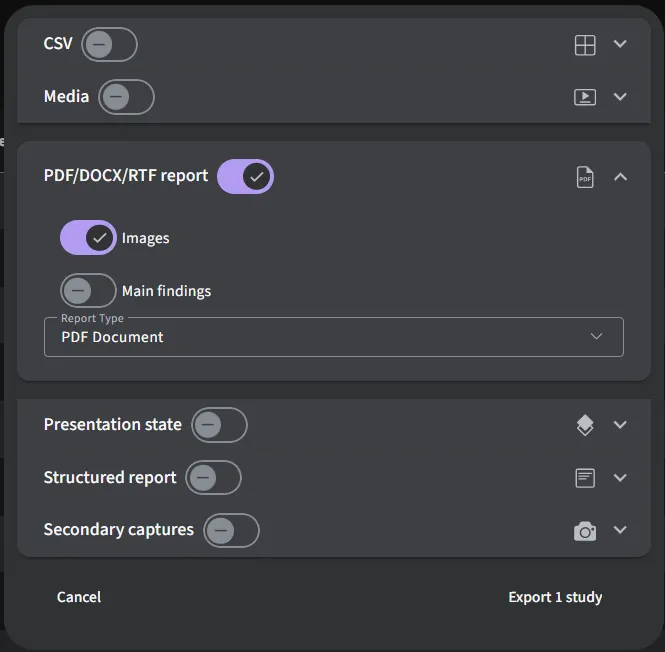
Select the studies you wish to export and navigate to “Export search results” section.
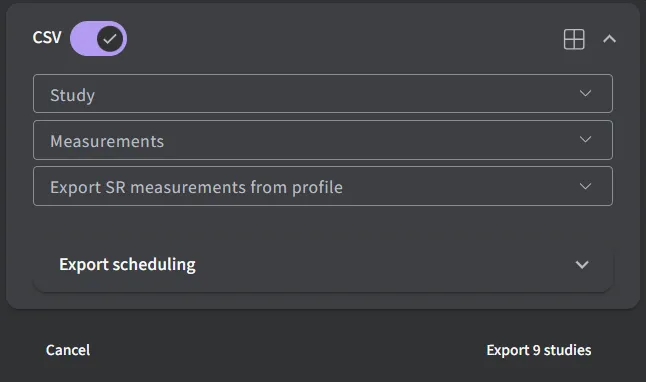
Toggle on “CSV” section. Specifiy the “Study” information and “Measurements” you want to export by selecting from the dropdown box.
You have the ability to schedule recurring exports of data in csv format. This enables you to automate the process of exporting data at regular intervals. Provide a name for the scheduled export in the “Name” field. Choose the desired mailing list and export frequency. You can set the export to occur daily, weekly, monthly or yearly. Set the start date and time for the recurring export using the provided date and time pickers.
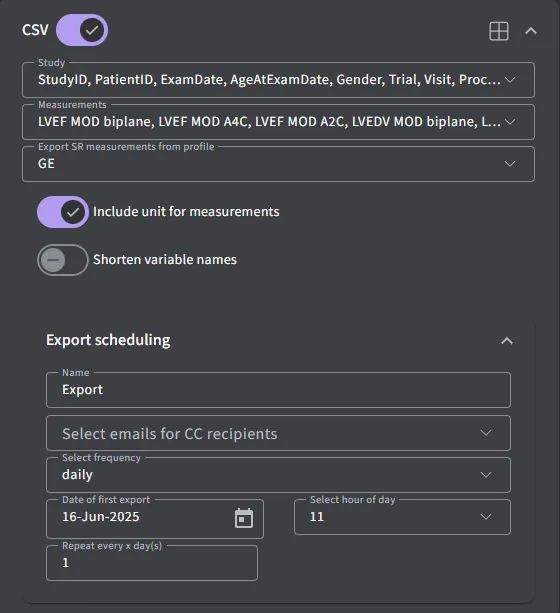
Review the summary of the scheduled export. Click “Export” to finalize the setup. Once scheduled, the application will automatically generate and deliver the CSV exports based on the specified recurrence pattern. You can manage your scheduled exports by visiting the “Scheduled Exports” section under the “Settings” where you can view, edit or cancel existing schedules as needed.
4.3.1 Sync
On page load, the Search Component uses the Sync Service to search parameters such as databases available, and referral reasons.
4.3.2 Refresh
The search results are periodically updated to keep the search results in sync with changes from other users or automated analysis.
4.3.3 Navigate
Clicking a row in the Search Result component will navigate to the report clicked. On click, the URL is changed to the report page, with the parameters associated with the row included. The URL is also encoded with information from the original search. This allows navigation between reports on the report page, based on the search parameters.
4.4 Viewing patient reports
The Report page displays patient reports in 2 panels,
- Detailed list of patient information, notes and automated findings based on International Cardiology guidelines. A video containing a moving chamber segmentation will be included if available.
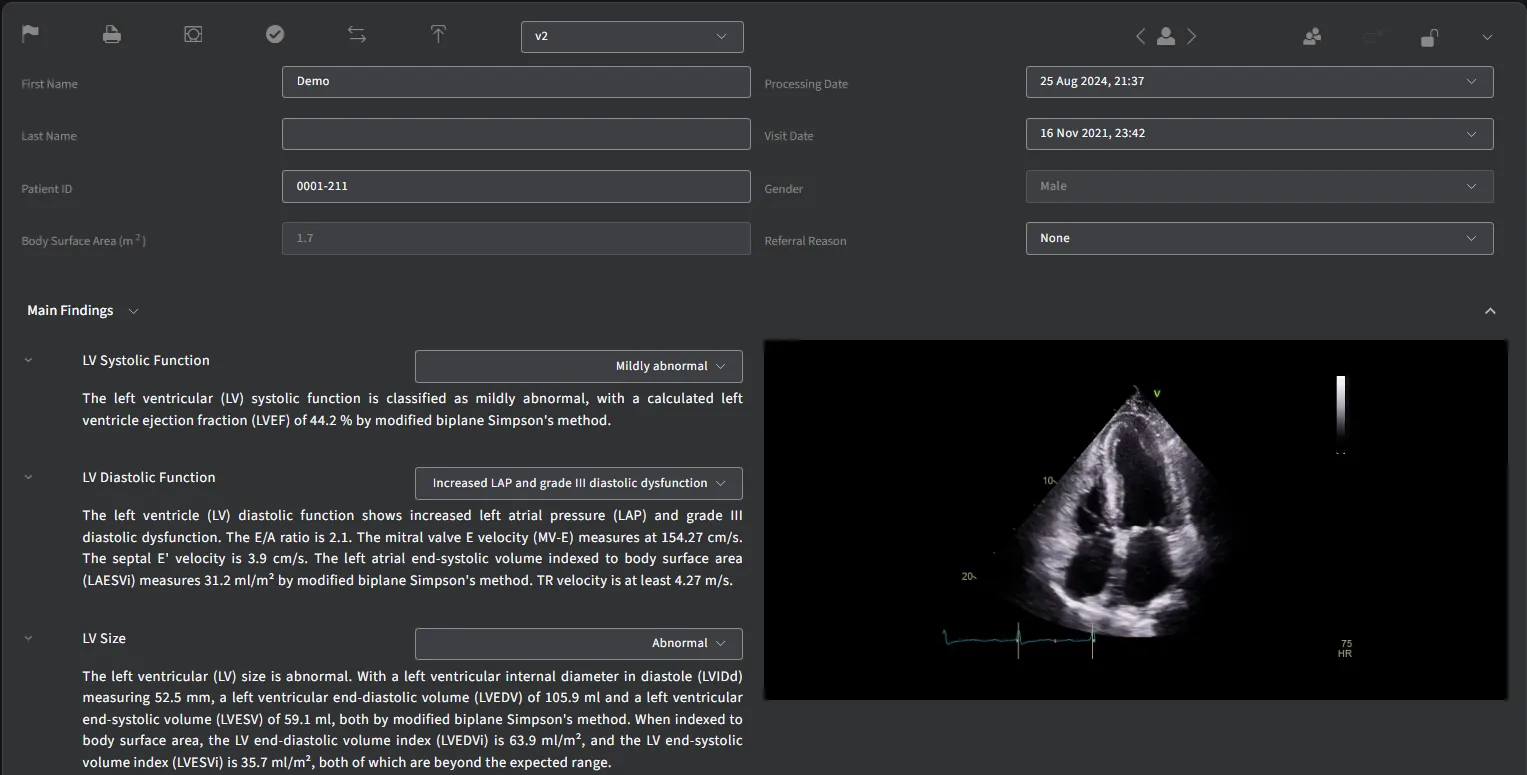
By selecting the patient ID from the dropdown list triggered by clicking on the Select Patient icon, the report reloads with information from the selected patient. The arrow buttons may also be used to navigate to next and previous patients.

- List of all measurements provided in the patient report, grouped by their respective headings with abnormal measurements displayed in red.
- Hovering over the measurements displayed in the report, the dependencies for that measurement are parsed and then passed into the preview component which displays the measurement on the custom editor canvas. If dependencies passed in consists of an array of derived measurements, the dropdown in the preview box will list all of the dependent measurements. If there is more than one value for a particular measurement, the top shopper for all measurements will be displayed, and an option to preview the rest will present itself as radio buttons. Each measurement displayed in the report is linked to the measurement URL to access the measurements page where edits may be applied.
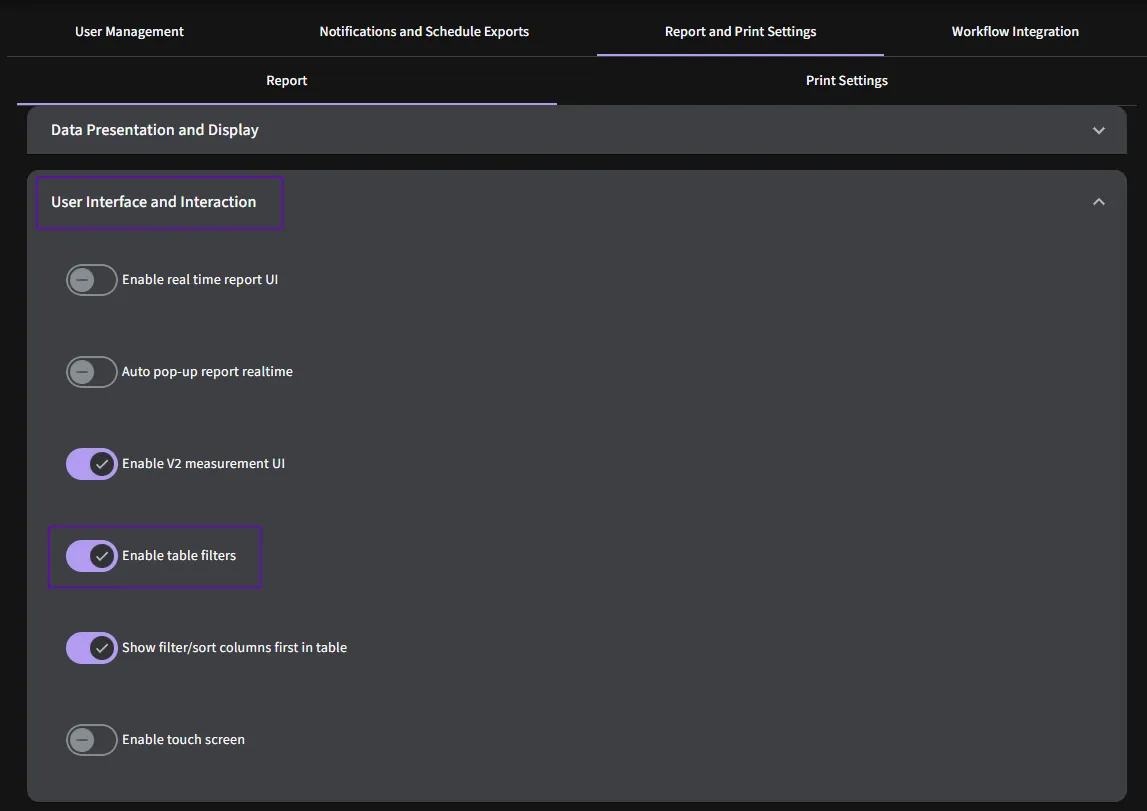
- To switch to the real-time user interface, follow these steps:
- Go to Settings.
- Select Reports and Print Settings.
- Locate the following options:
- Enable Real-Time Report UI
- Enable V2 Measurement UI
- Toggle both options on to activate the updated user interface.
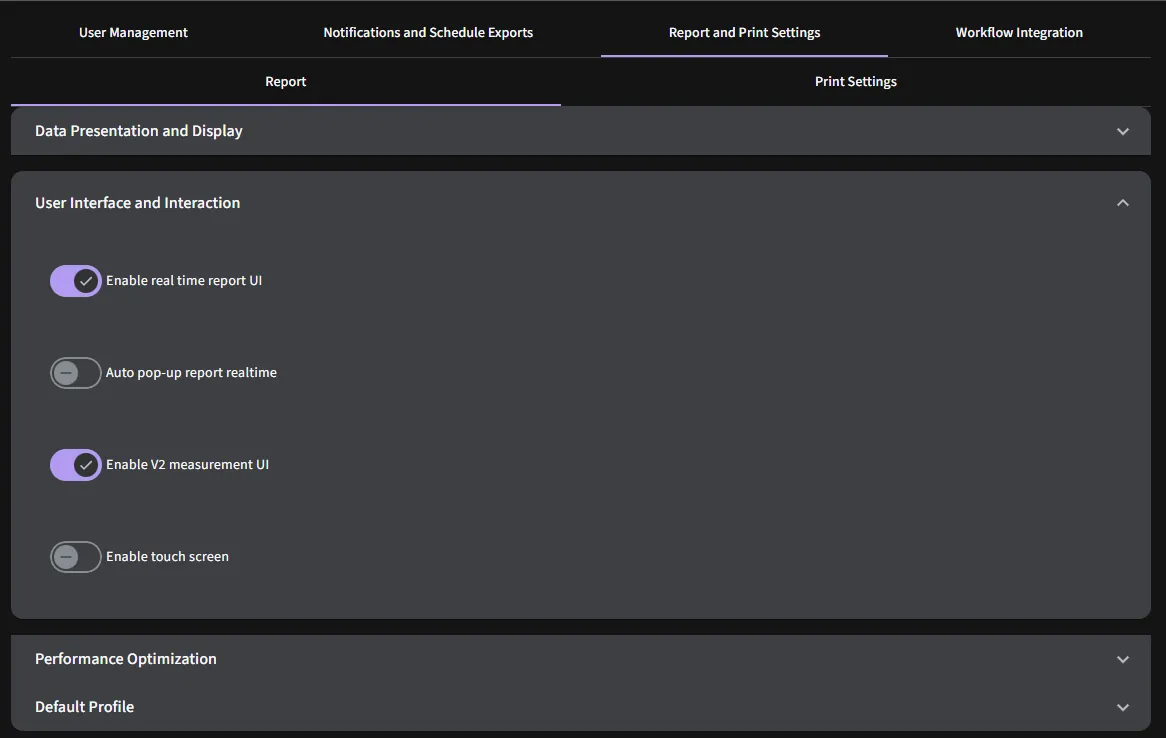
Once enabled, the new view will be applied for all supported workflows.
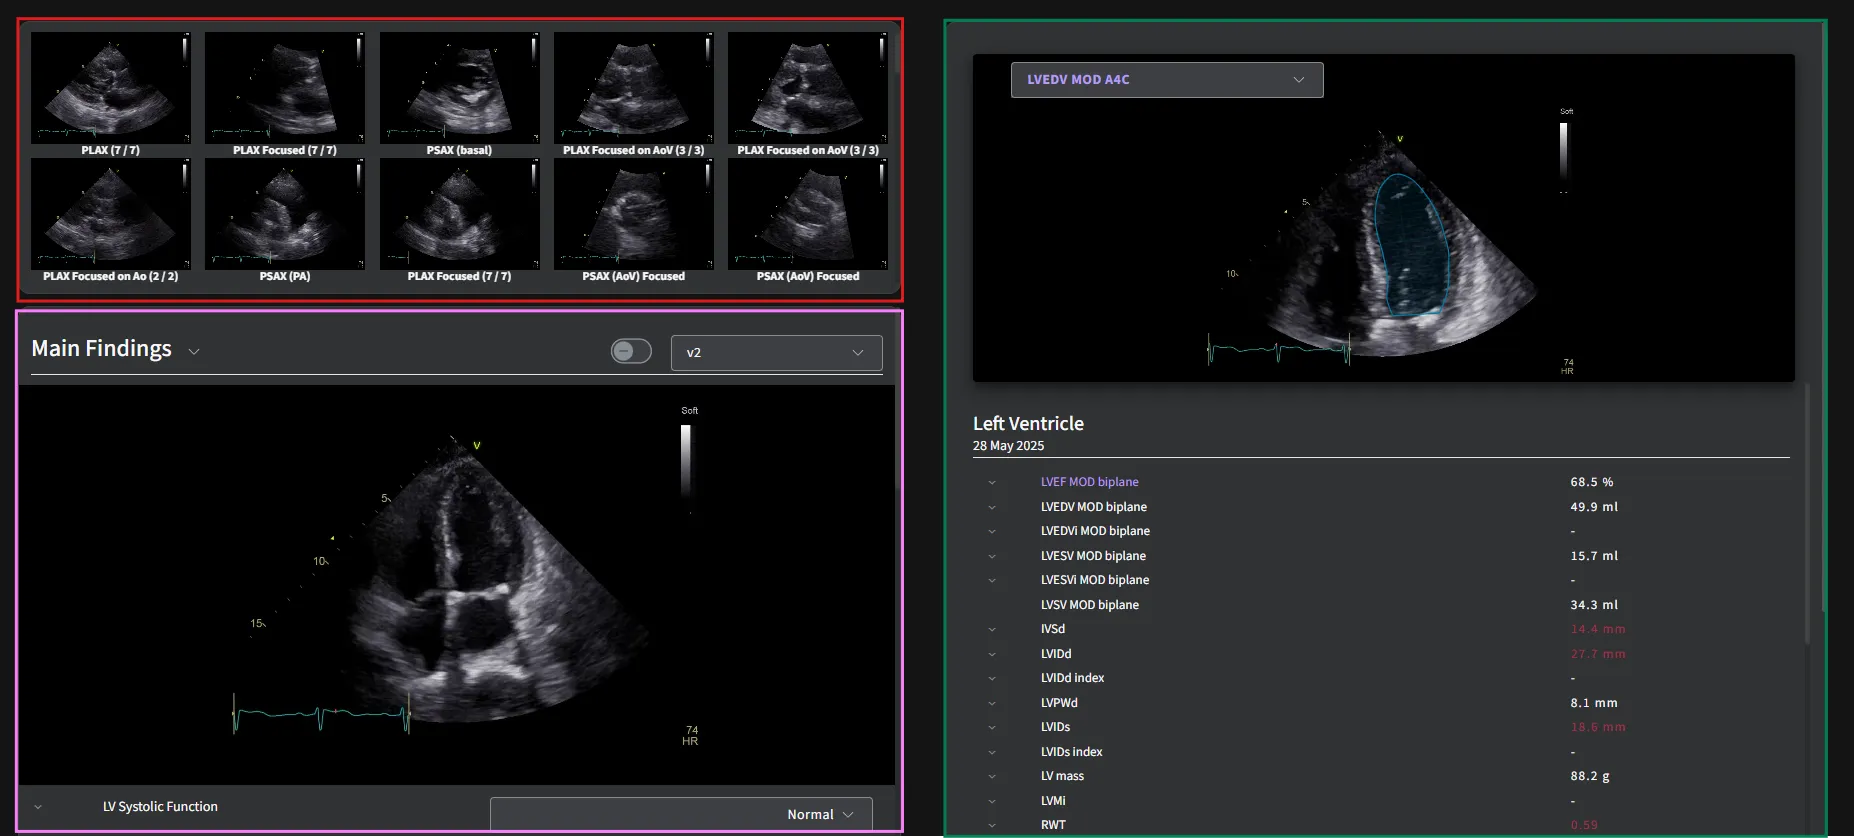
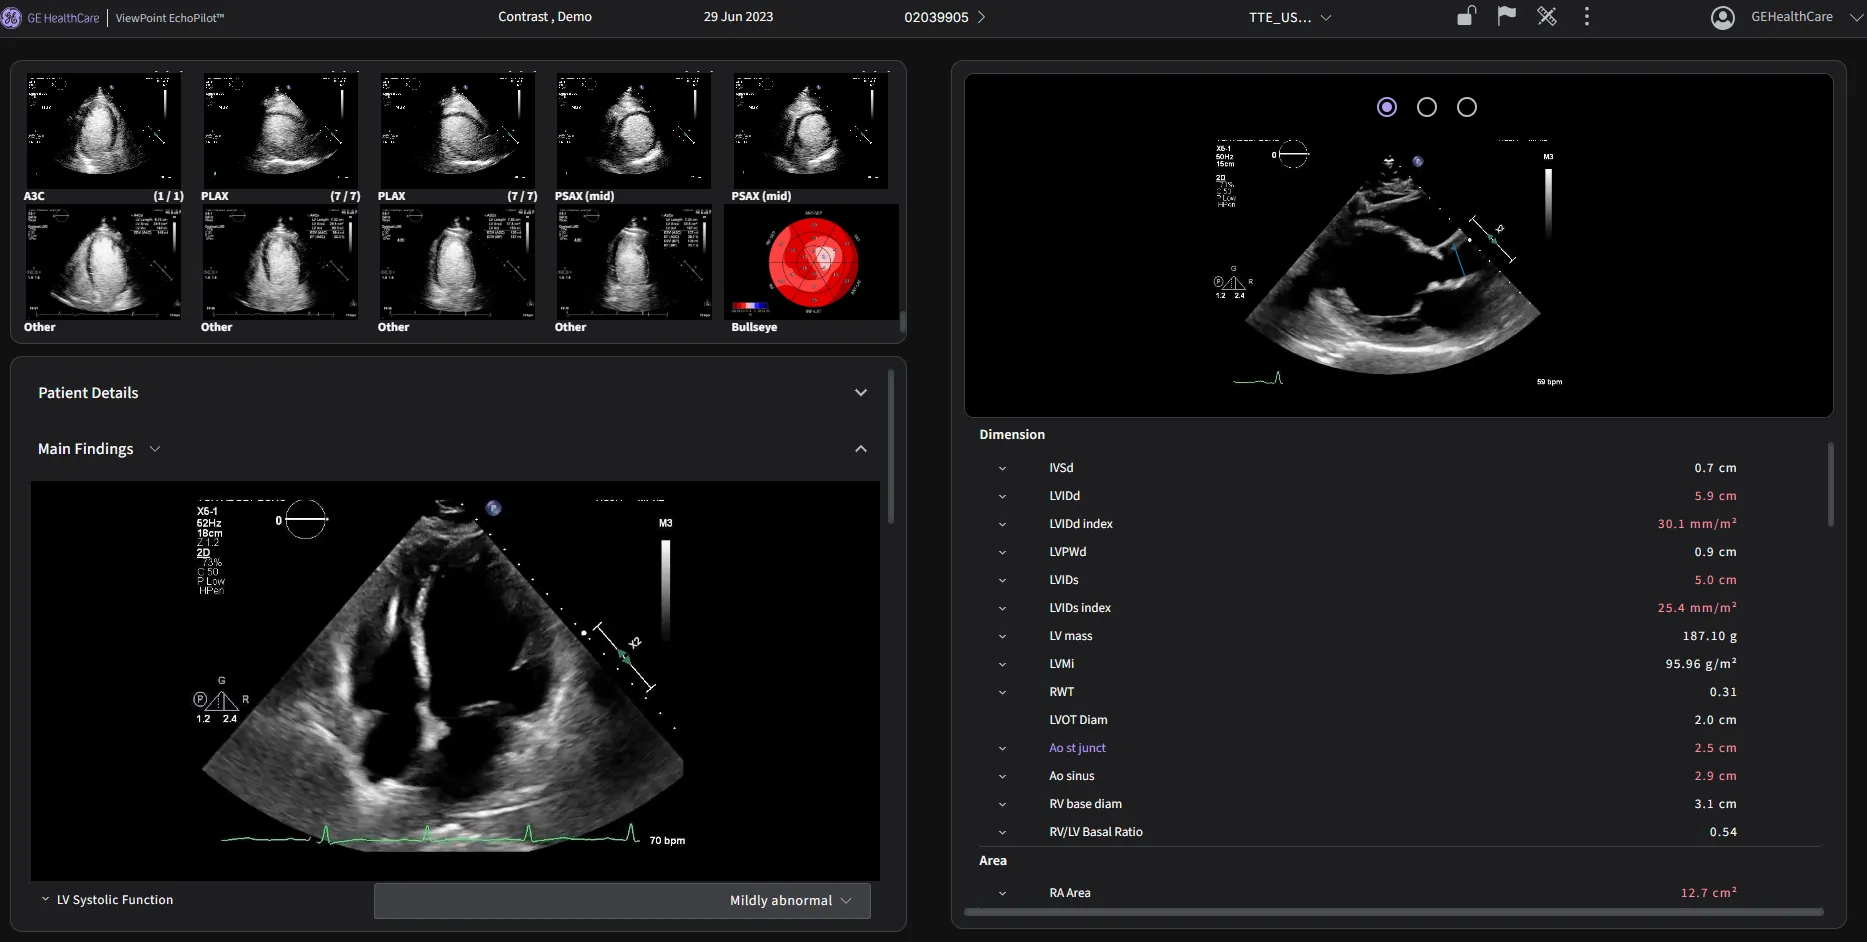
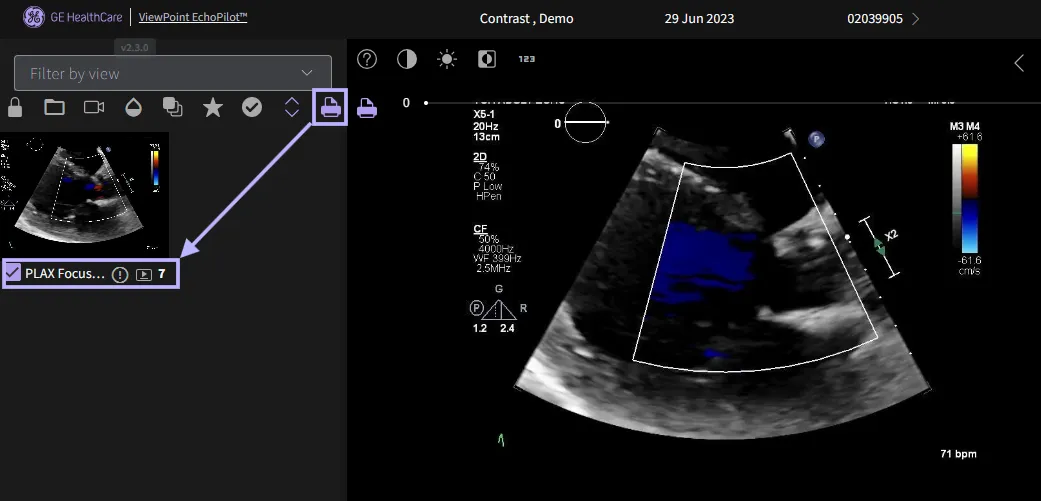
Image Overview Panel – Displays all acquired images.
- Image thumbnails: This screen displays all echocardiographic views available in a study. Each tile represents a still frame from a standard echocardiographic view.
- Interactive Preview: When you hover over a tile, the corresponding clip will begin to play, allowing you to quickly preview the view.
- View Labels: The label beneath each thumbnail indicates the view type and measurement completion status.
- For example, PLAX (7/7) means that 7 out of 7 required measurements have been completed for the Parasternal Long Axis (PLAX) view.
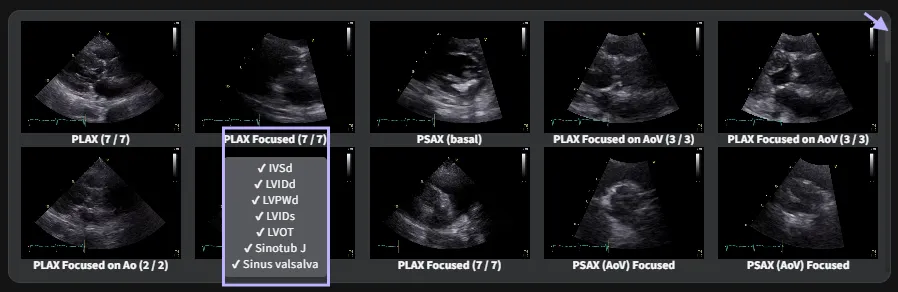
- Measurement checklist: When a tile is selected (e.g. PLAX Focused), a checklist appears showing the measurements completed for that view. Checkmarks (✓) indicate completed measurements.
- Scroll bar: The arrow icon in the top-right corner represents a scroll bar. Use this to view additional image tiles that are not immediately visible on the screen.
Report Display Panel – Shows the patient's report.
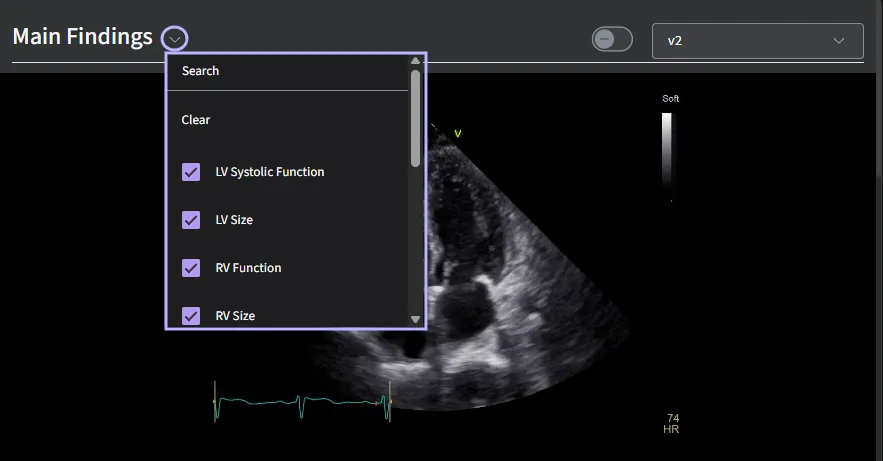
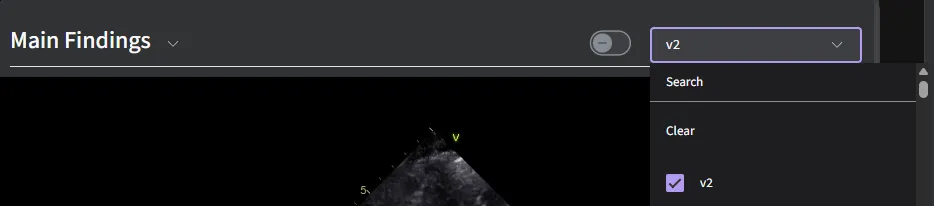
- Findings Dropdown: The dropdown menu located next to the Main Findings section allows you to add or remove findings in the report. This helps customize the report content based on the specific exam findings.
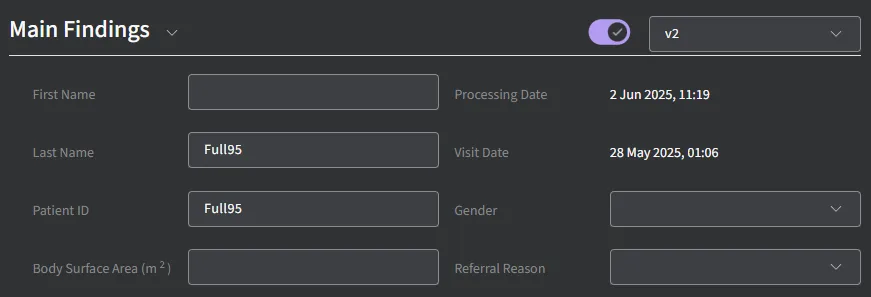
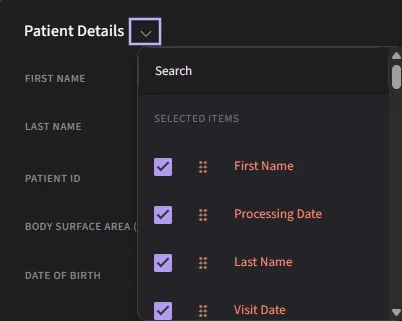
- Patient Details Toggle: When the toggle switch is enabled, full patient demographic information will be displayed. This includes patient name, ID, date of birth, and other relevant details.
- Protocol Dropdown: A separate dropdown is available to change the imaging protocol if needed. This allows you to switch to a different protocol template that better matches the study or clinical indication.
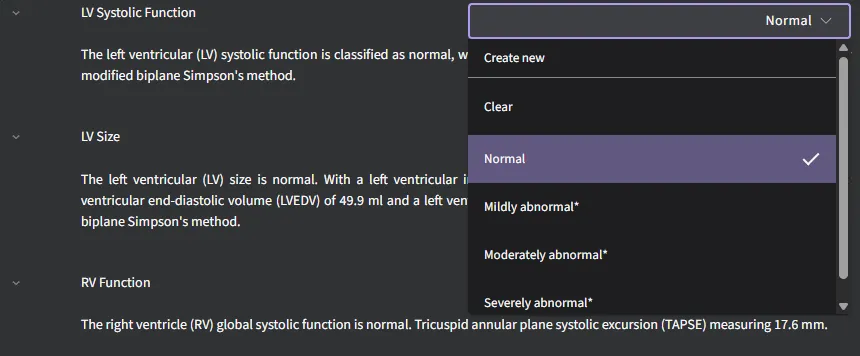
- Editing the Conclusion: The Conclusion for any main finding can be overridden by selecting an alternative option from the dropdown menu.
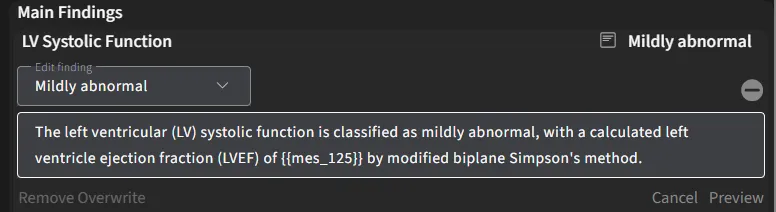
- Narrative Paragraph Editing: Similarly, the narrative paragraph in the report can be edited:
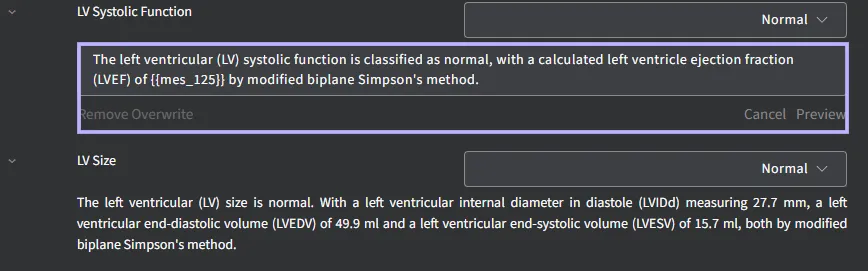
- Ctrl + Left Click on the text to begin editing.
- Use Preview to review your changes, then click Save.
- Select "Remove Overwrite" to restore the original paragraph.
- Editing the Conclusion: You may also manually edit the conclusion paragraph:
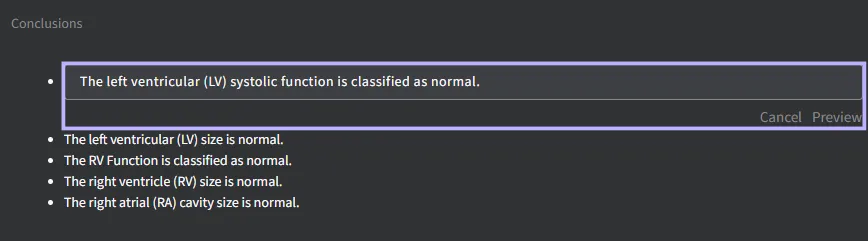
- Ctrl + Left Click on the paragraph to enable editing.
- After editing, click Preview, then Save to apply your changes.
- To revert to the default text, select "Remove Overwrite".
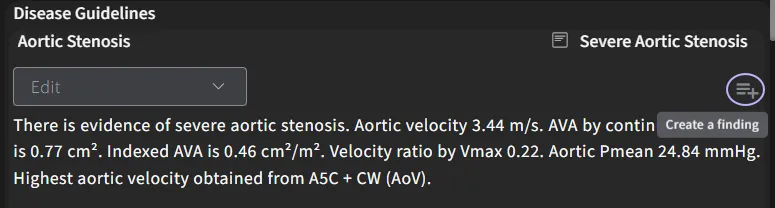
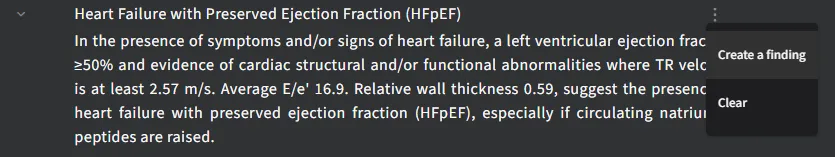
- Adding Findings: All findings within the Disease Guidelines section can be added to the Main Findings by clicking the hamburger icon next to the relevant entry.
- Select "Create a finding" to move the item to the Main Findings section.


- To remove a finding from the report, select "Clear" from the same menu.
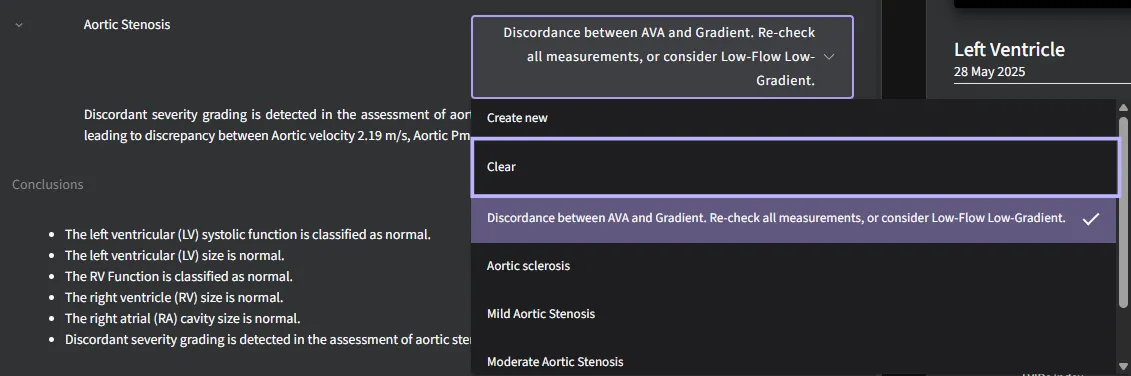
- Select "Create a finding" to move the item to the Main Findings section.
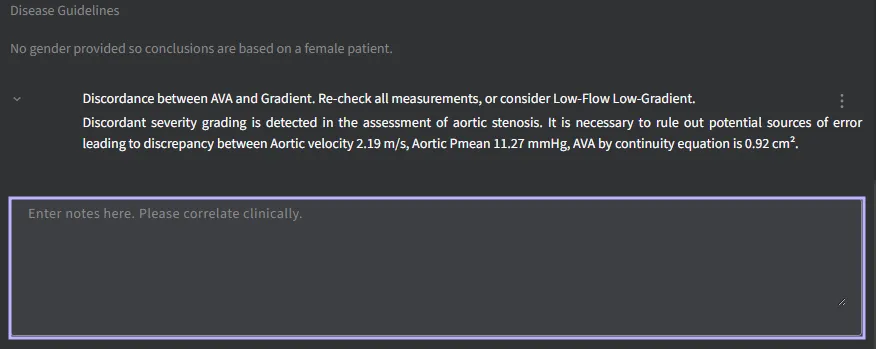
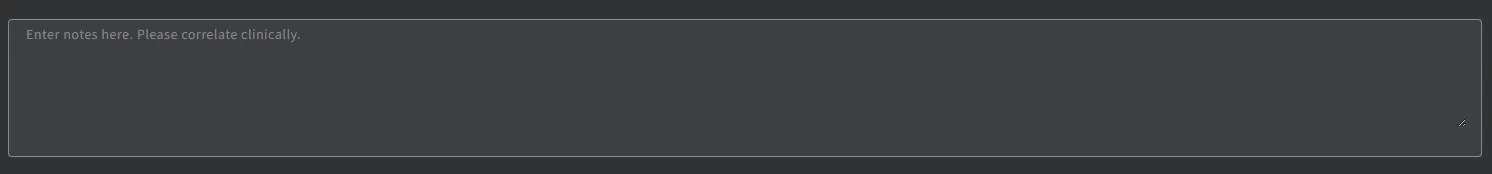
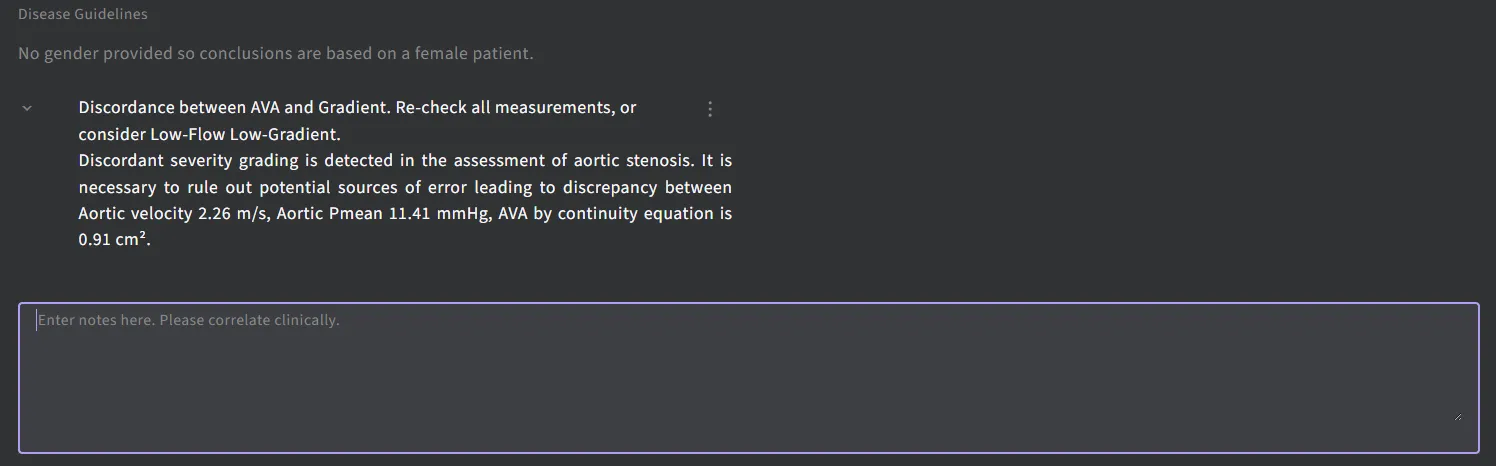
- Notes Field: The Notes field can be used to add clinical correlations or additional observations. Once you make an edit, a Save button will automatically appear to let you save your changes.
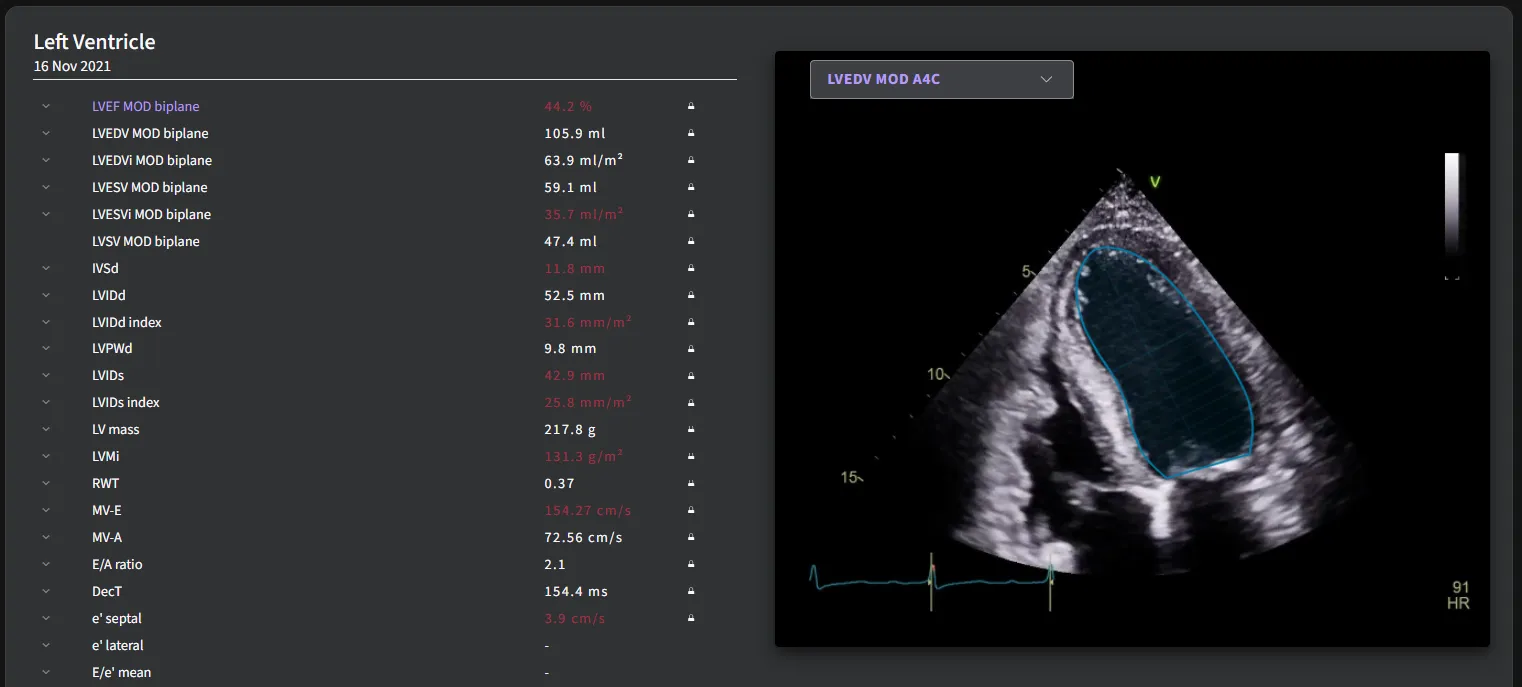
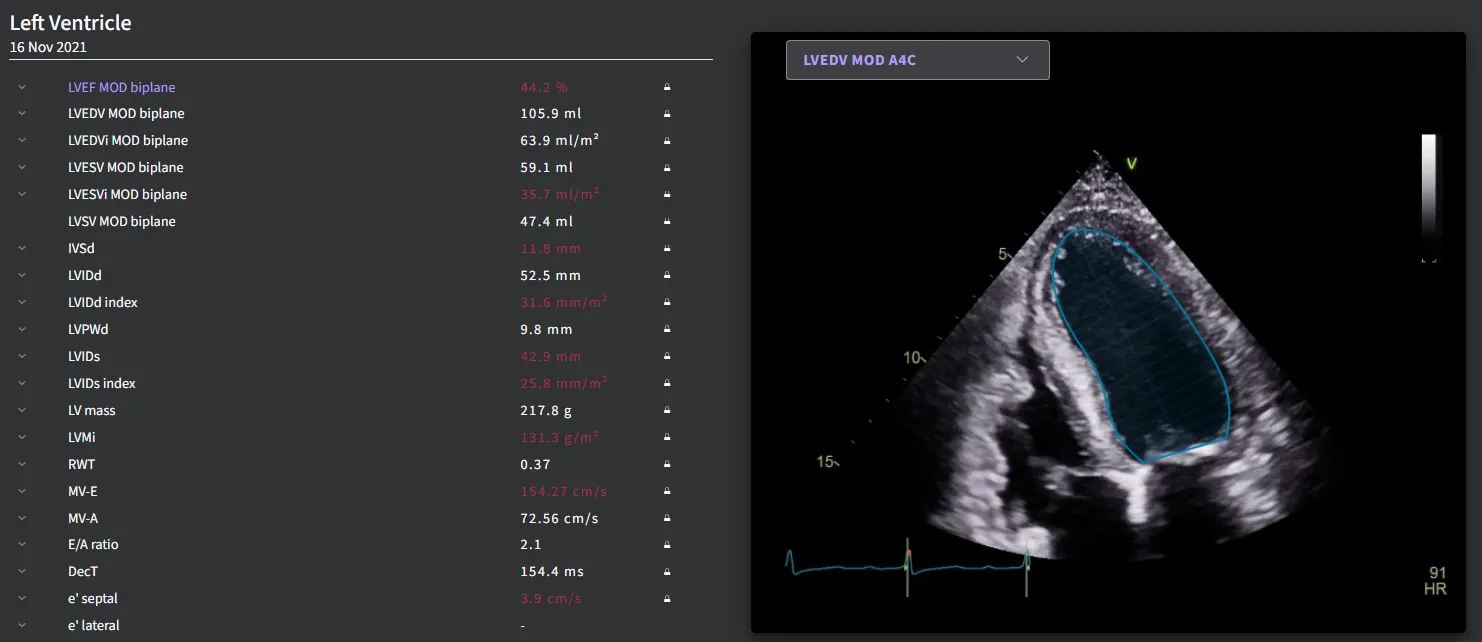
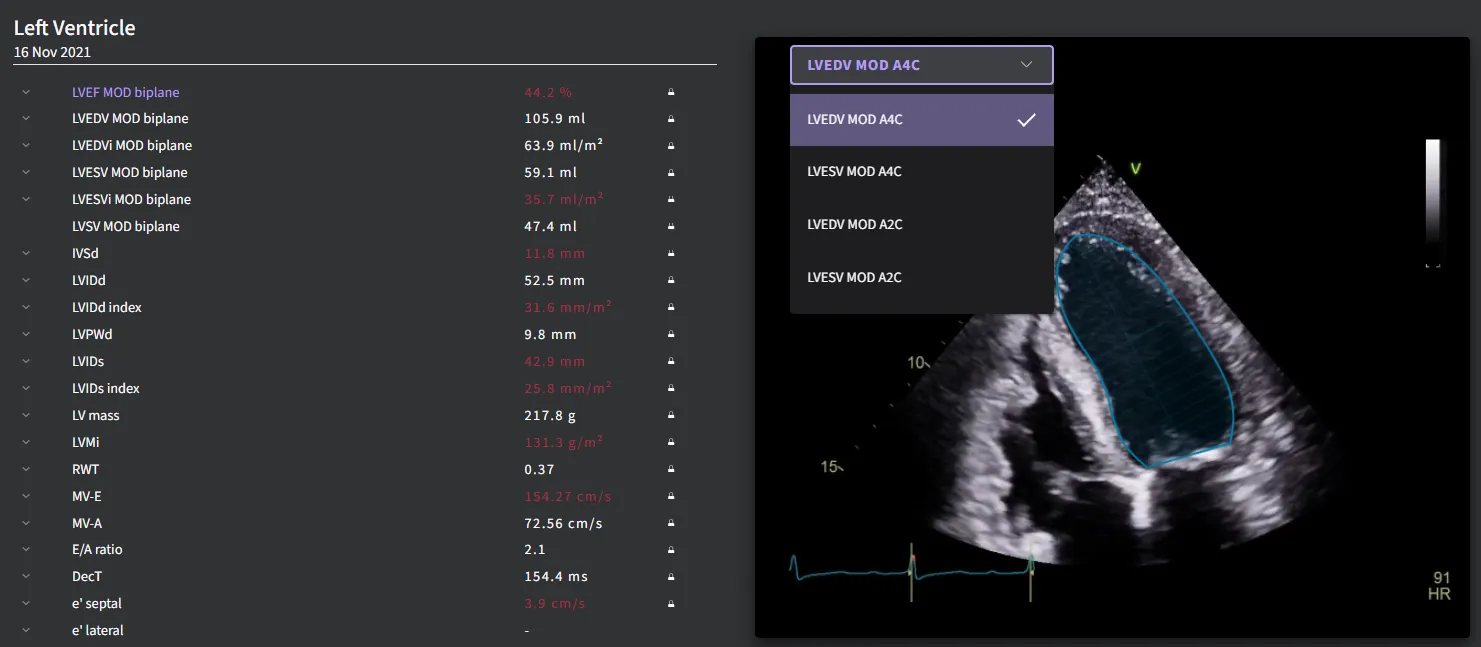
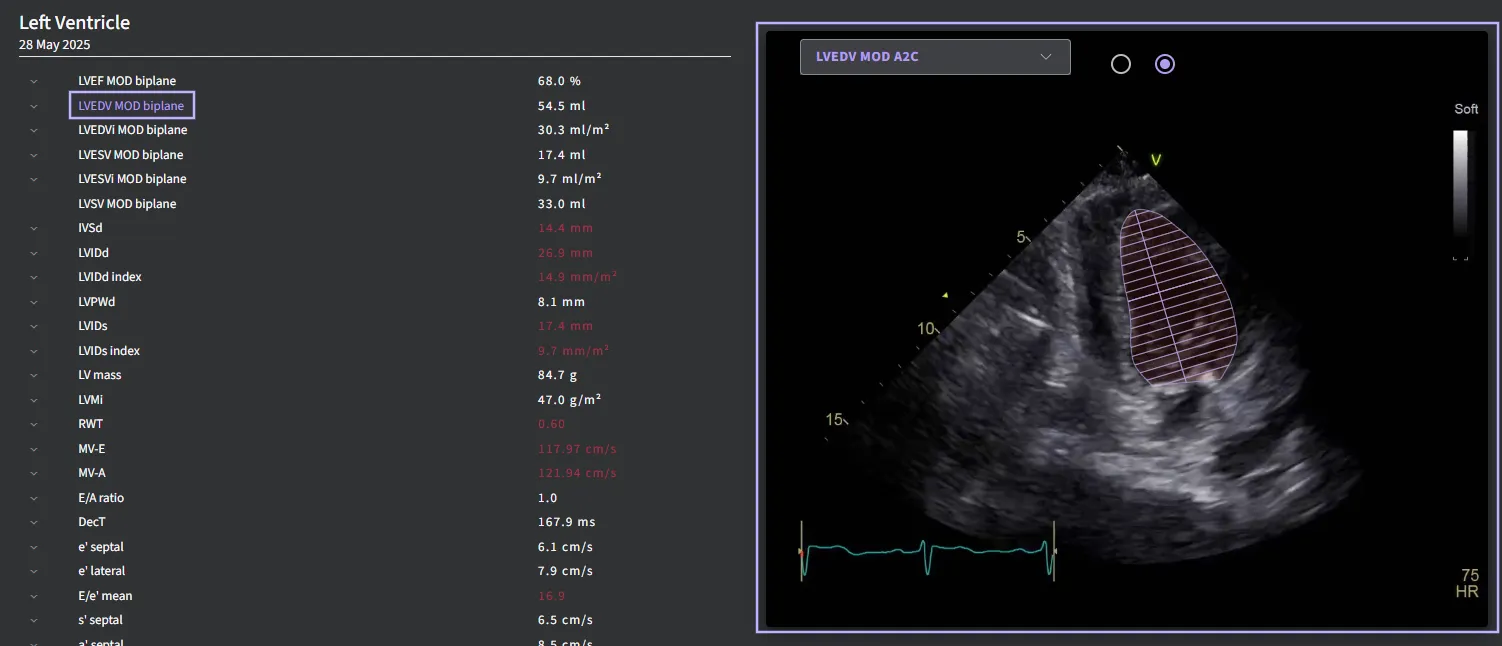
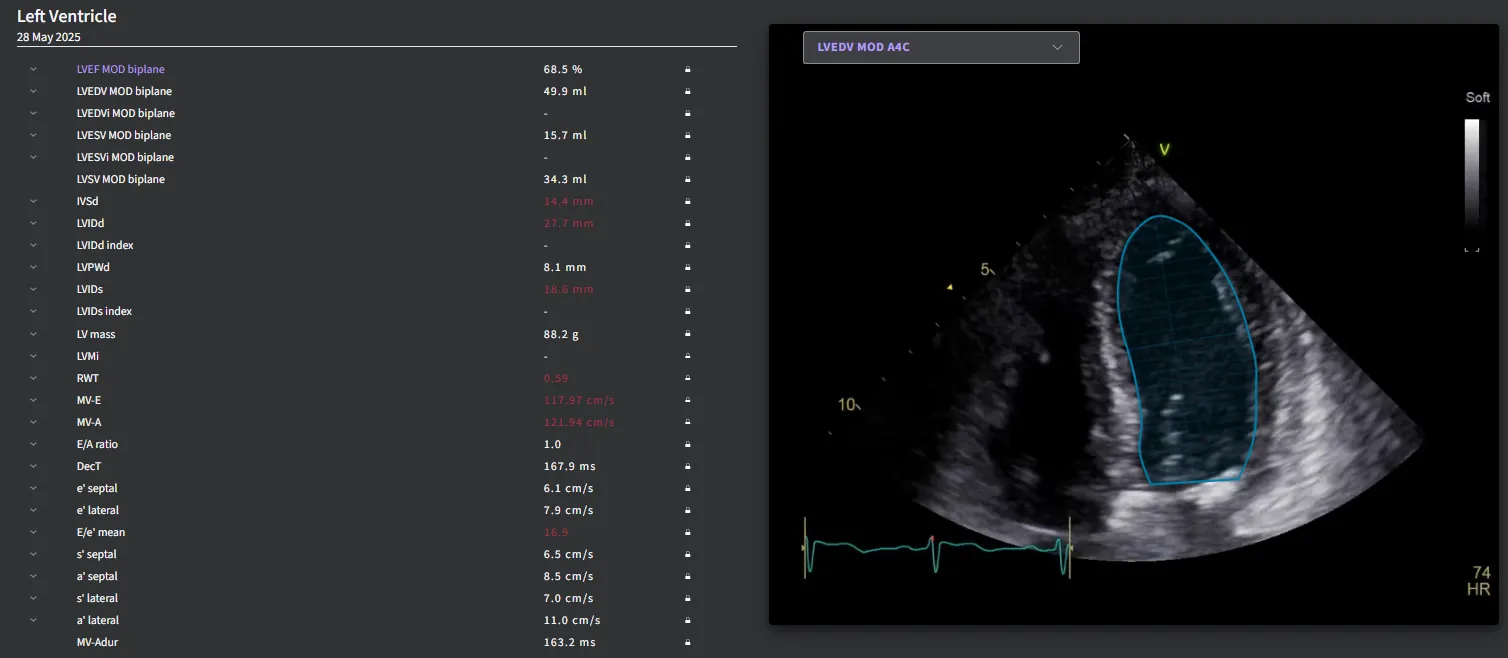
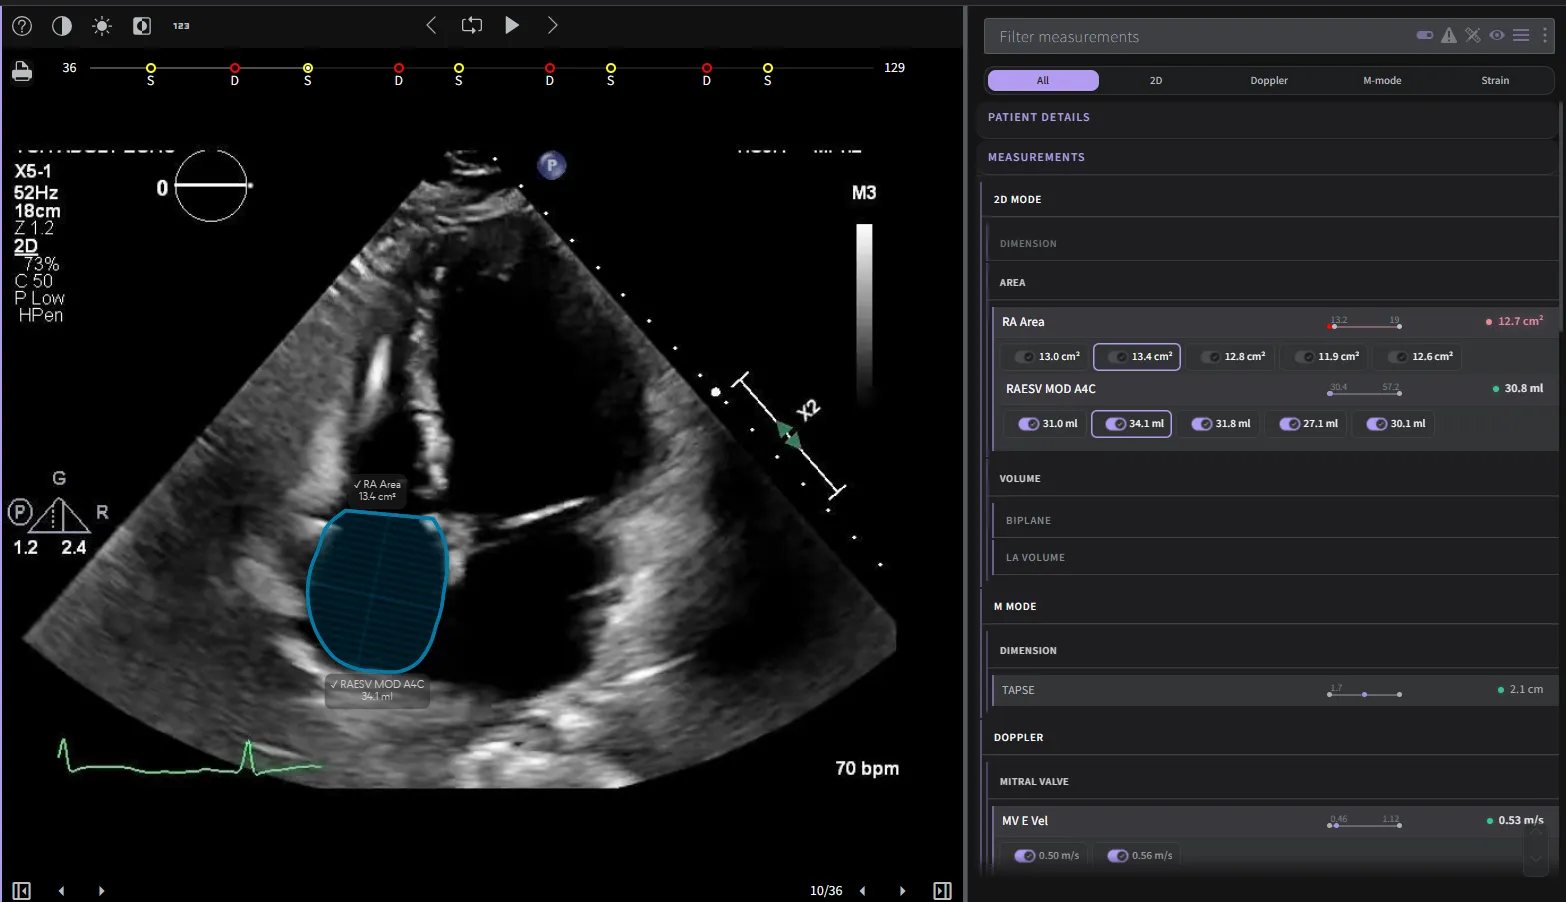
Measurement Display Panel – Displays the measurements.
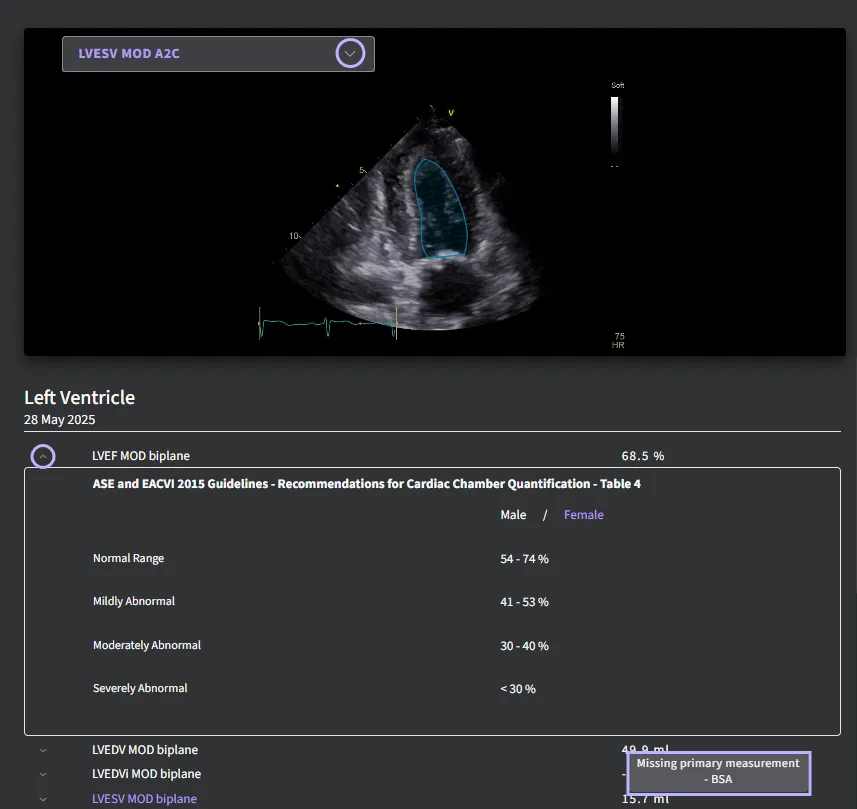
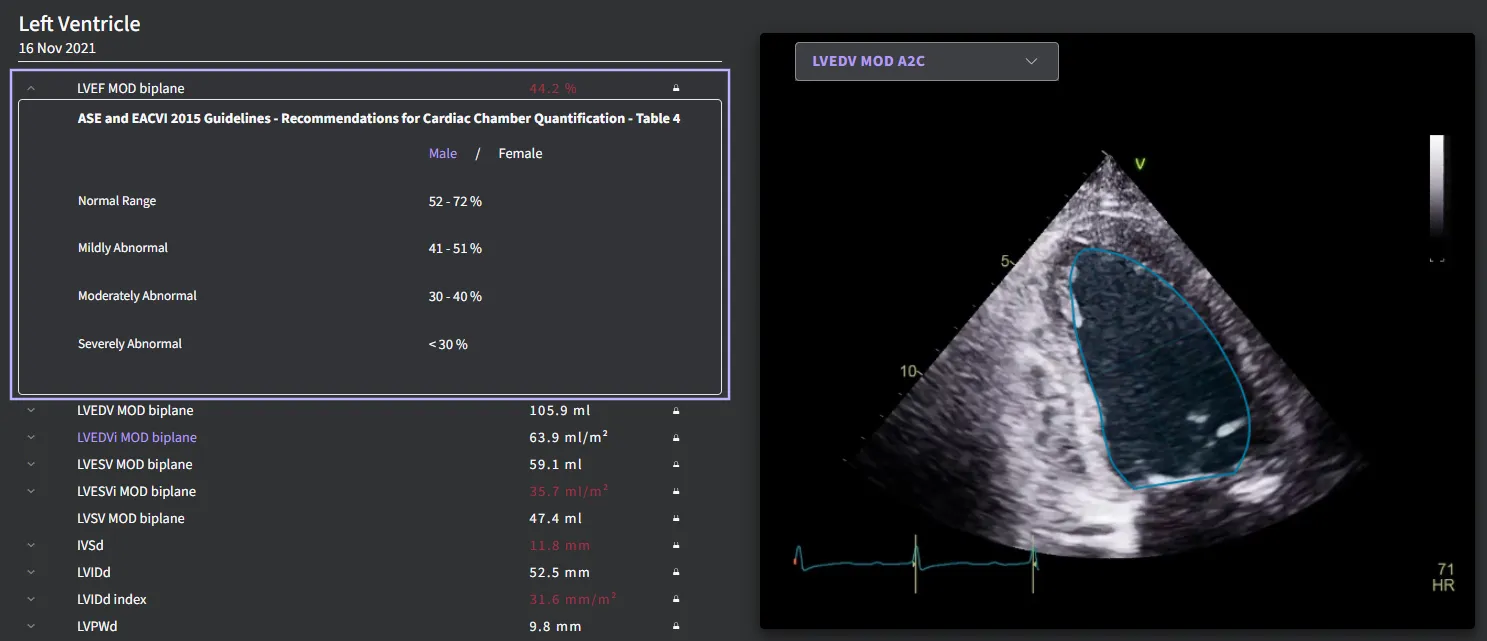
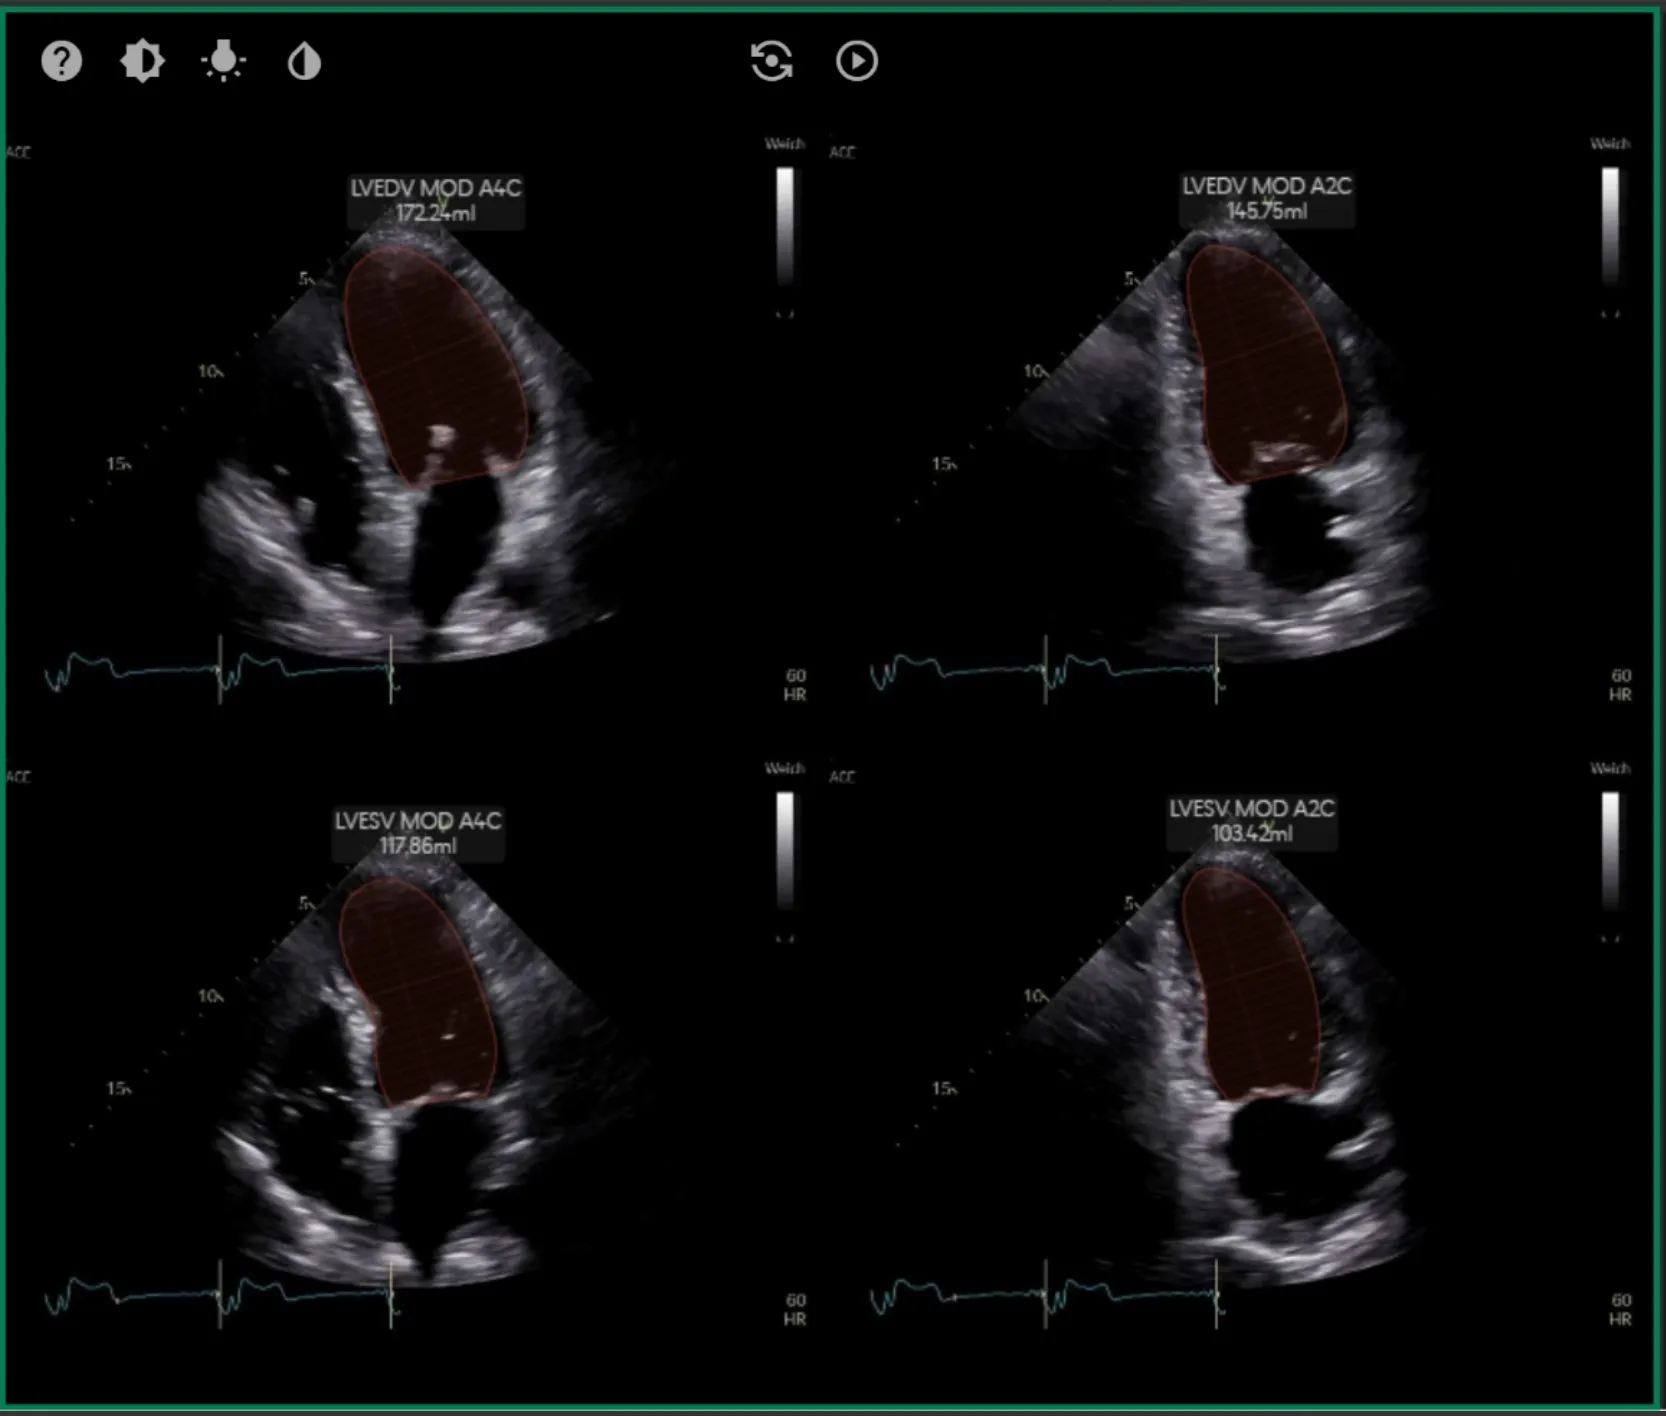
- Primary Image Panel: When you hover over a measurement name in the list, the application will display a preview of the corresponding annotation directly on the image, along with the underlying measurement (e.g., LV traced borders). If a value falls outside the normal range, it will be highlighted in red to alert the user.
- Guideline Reference Table: A guideline table is shown once expanding the toggle.
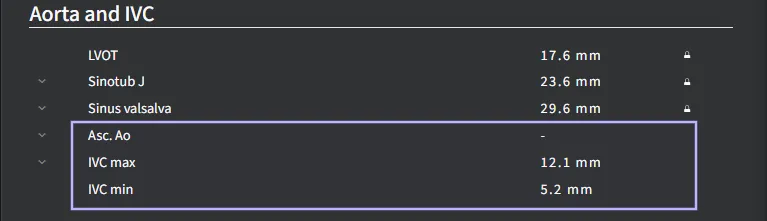
- Missing Primary Measurement Notification: When you hover over the dash (“–”) icon, a tooltip will appear indicating what data is missing. In this example, the tooltip notifies user that (BSA – Body Surface Area) measurement is missing. This is needed for indexing volume measurements to body size (e.g., LVEDVi, LVESVi). Users should enter BSA information in the application to generate indexed values.
4.4.1 Primary Measurements
The following measurements are available:
| S/N | Measurement | Description |
|---|---|---|
| 1 | LVEF MOD Biplane | Left Ventricular Ejection Fraction calculation based on Method of Disks |
| 2 | LVEDV MOD Biplane | Left Ventricular End Diastolic Volume biplane calculation based on Method Of Disks |
| 3 | LVESV MOD Biplane | Left Ventricular End Systolic Volume biplane calculation based on Method Of Disks |
| 4 | LVSV MOD Biplane | Left Ventricular Stroke Volume biplane calculation based on Method Of Disks |
| 5 | LAESV MOD Biplane | Left Atrial End Systolic Volume biplane calculation based on Method Of Disks |
| 6 | RA Area | Right Atrial area at end systole |
| 7 | RVIDd | Right Ventricular Internal Diameter at end diastole |
| 8 | LVIDd | Left Ventricular Internal Diameter at end diastole |
| 9 | LVIDs | Left Ventricular Internal Diameter at end systole |
| 10 | LVPWd | Left Ventricular Posterior Wall thickness at end diastole |
| 11 | IVSd | Inter Ventricular Septal thickness at end diastole |
| 12 | PWTDI lateral e’ | Early diastolic tissue velocity taken from the lateral wall of LV |
| 13 | PWTDI lateral a’ | Late diastolic tissue velocity taken from the lateral wall of LV |
| 14 | PWTDI lateral s’ | Systolic tissue velocity taken from the lateral wall of LV |
| 15 | PWTDI septal e’ | Early diastolic tissue velocity taken from the septal wall of LV |
| 16 | PWTDI septal a’ | Late diastolic tissue velocity taken from the septal wall of LV |
| 17 | PWTDI septal s’ | Systolic tissue velocity taken from the septal wall of LV |
| 18 | PWMV E | Pulse wave velocity of early diastolic transmitral flow |
| 19 | PWMV A | Pulse wave velocity of late diastolic transmitral flow |
| 20 | PWMV DecT | Deceleration Time of early diastolic MV transmitral flow |
| 21 | PWMV ADur | Late diastolic transmitral flow |
| 22 | E/e’ mean | E/e’ mean |
| 23 | CW TrV Vmax | Continuous wave of tricuspid regurgitation maximum velocity |
| 24 | LV GLS | Left ventricular global longitudinal strain |
| 25 | A4C LV GLS | Left ventricular global longitudinal strain in A4C |
| 26 | A3C LV GLS | Left ventricular global longitudinal strain in A3C |
| 27 | A2C LV GLS | Left ventricular global longitudinal strain in A2C |
| 28 | LV Regional Strain | LV Regional Strain |
| 29 | TAPSE | Tricuspid annular plane systolic excursion |
| 30 | RV E ‘ | Early diastole tissue velocity taken from right ventricular free wall |
| 31 | RV A’ | Late diastole tissue velocity taken from right ventricular free wall |
| 32 | RV S’ | Systolic tissue velocity taken from right ventricular free wall |
| 33 | Sinotubular Junction | Sinotubular Junction diameter |
| 34 | Sinus valsalva | Sinus of valsalva diameter |
| 35 | LVOT Diameter | Left ventricular outflow tract diameter |
| 36 | CW AoV Vmax | Continuous wave aortic valve maximum velocity |
| 37 | CW AoV VTI | Continuous wave aortic valve velocity time integral |
| 38 | CW AoV Pmax | Continuous wave aortic valve maximum pressure |
| 39 | CW AoV Pmean | Continuous wave aortic valve mean pressure |
| 40 | PW LVOT Vmax | Pulse wave left ventricular outflow tract maximum velocity |
| 41 | PW LVOT VTI | Pulse wave left ventricular outflow tract velocity time integral |
| 42 | PW LVOT Pmax | Pulse wave left ventricular outflow tract maximum pressure |
| 43 | PW LVOT Pmean | Pulse wave left ventricular outflow tract mean pressure |
| 44 | AVA | Aortic valve area |
| 45 | VR | Velocity ratio |
When approved International Reference Guidelines are available for a measurement, they can be viewed, along with the exact reference where the Guideline determination can be found, in an expanded panel by clicking on the arrow next to the measurement name.
If measurement values are available in the Report, then the parameters in approved International Reference Guidelines will be used to generate Main Findings or Clinical Notes for the study. If any measurement values required by the International Reference Guidelines are missing, then the related Main Finding will not be displayed.
4.4.2 International Reference Guidelines
The list of possible Main Findings that can be displayed using International Reference Guidelines are:
LV Systolic Function
LV Diastolic Function
LV Size
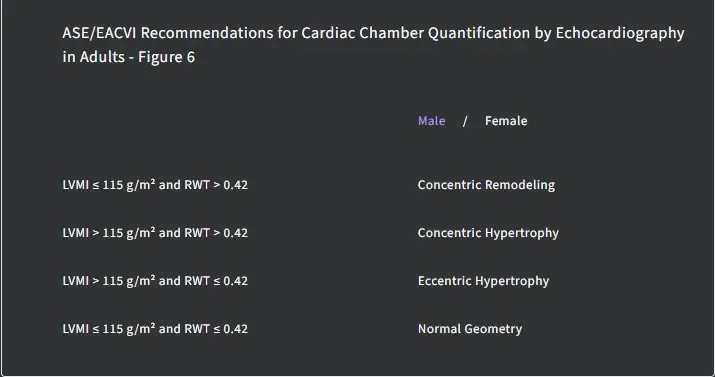
LV Geometry
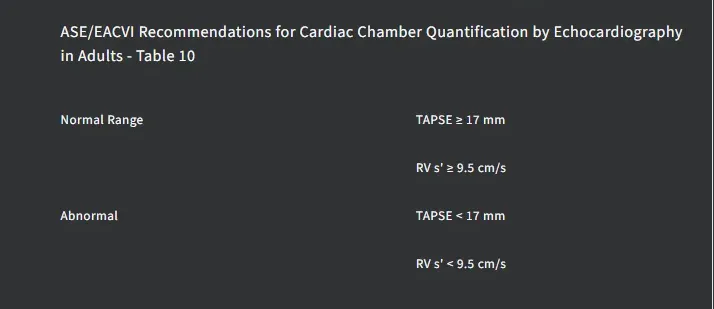
RV Function
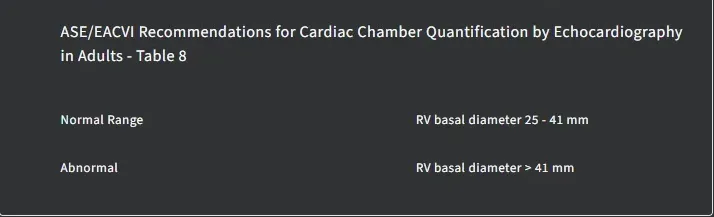
RV Size
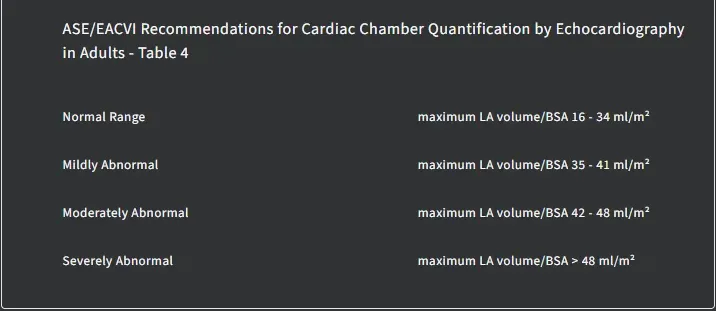
LA Size
RA Size

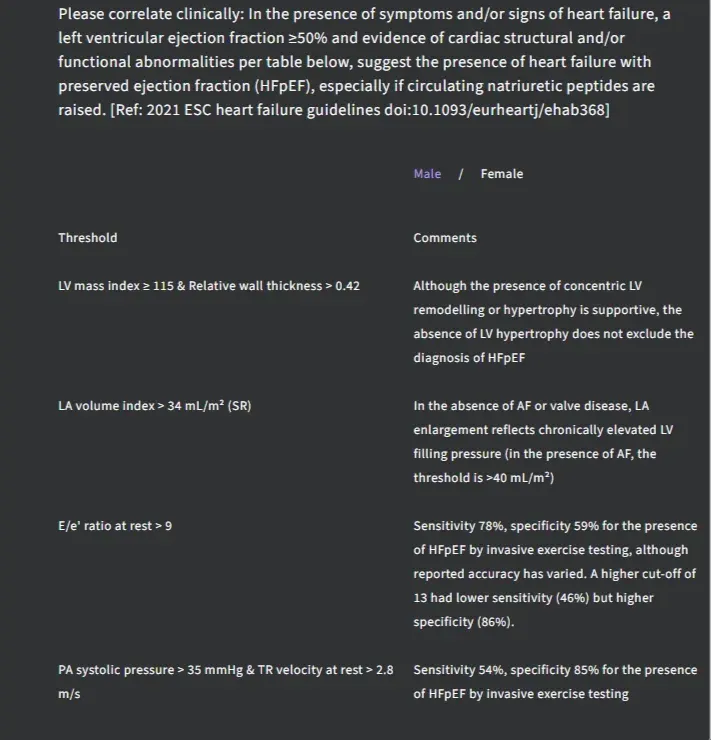
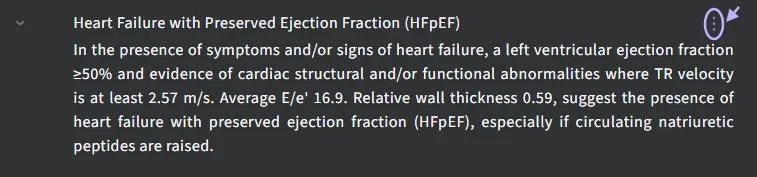
Heart Failure with Preserved Ejection Fraction (HFpEF)
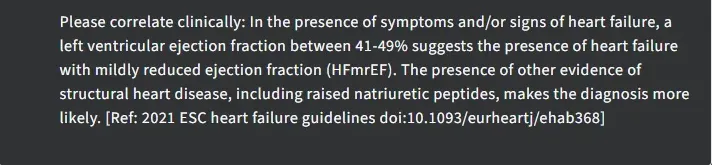
Heart Failure with mildly reduced Ejection Fraction (HFmrEF)
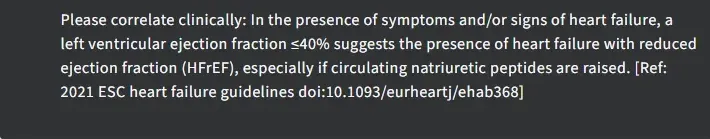
Heart Failure with reduced Ejection Fraction (HFrEF)
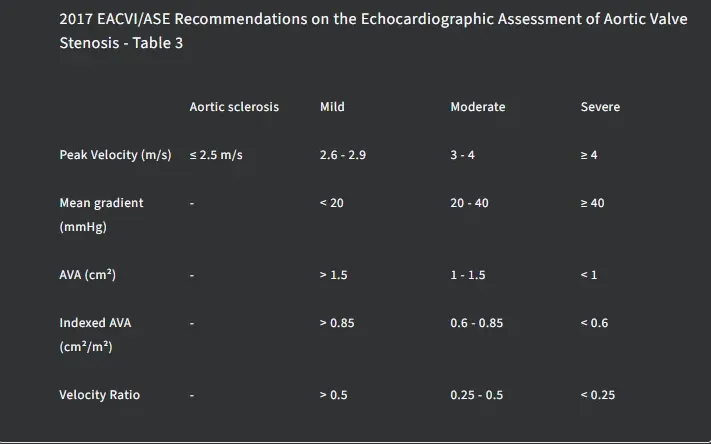
Mild Aortic Stenosis

Moderate Aortic Stenosis

Severe Aortic Stenosis
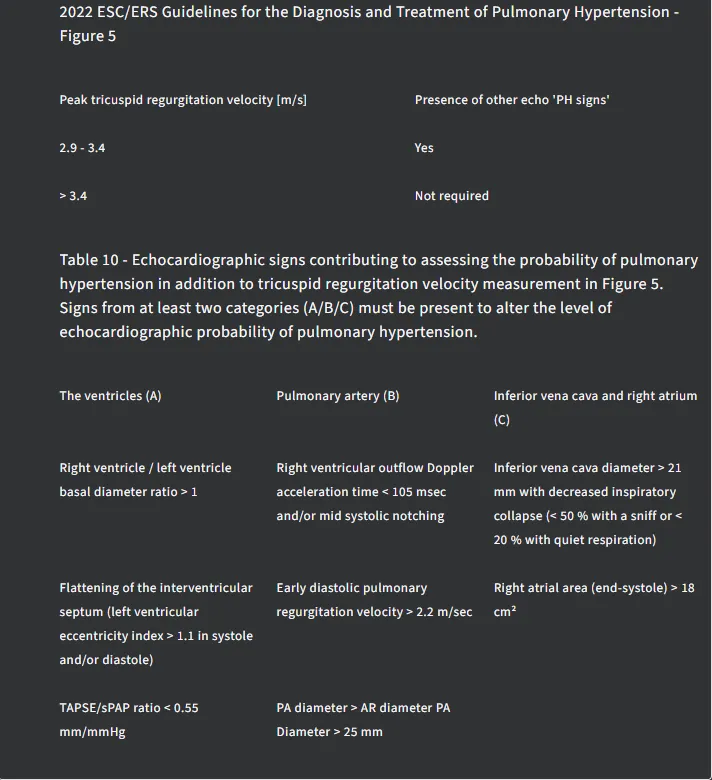
Intermediate (cannot rule out high) Echocardiographic Probability of Pulmonary Hypertension
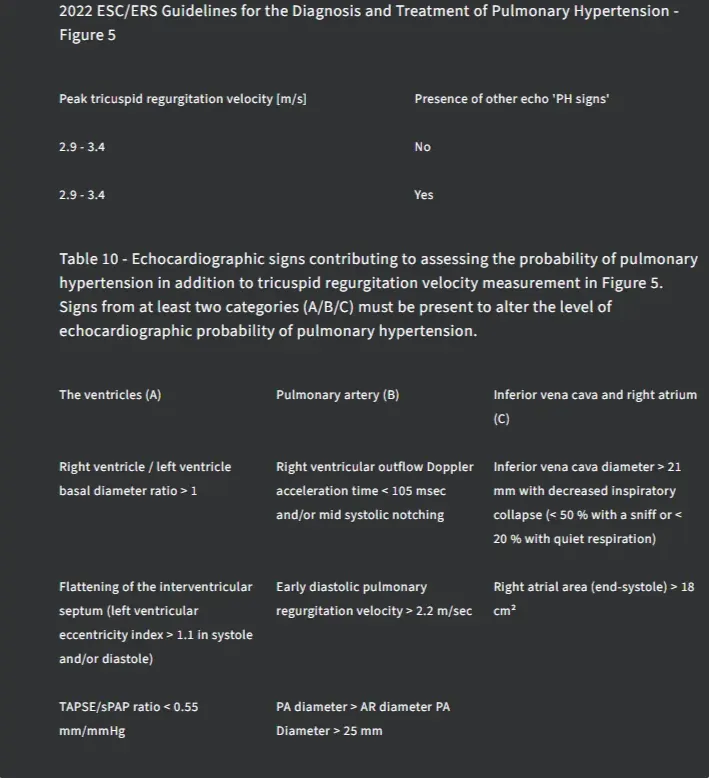
Intermediate Echocardiographic Probability of Pulmonary Hypertension
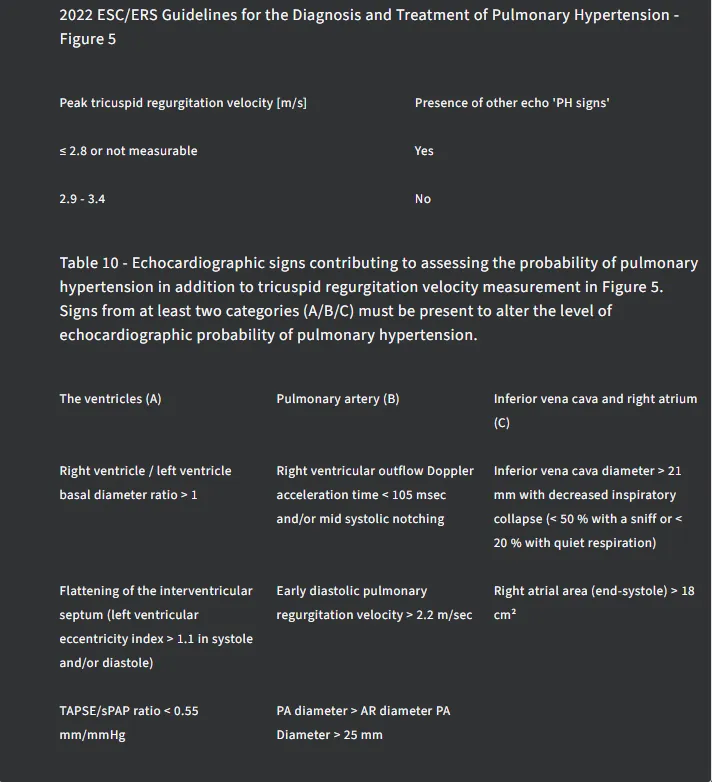
High Echocardiographic Probability of Pulmonary Hypertension
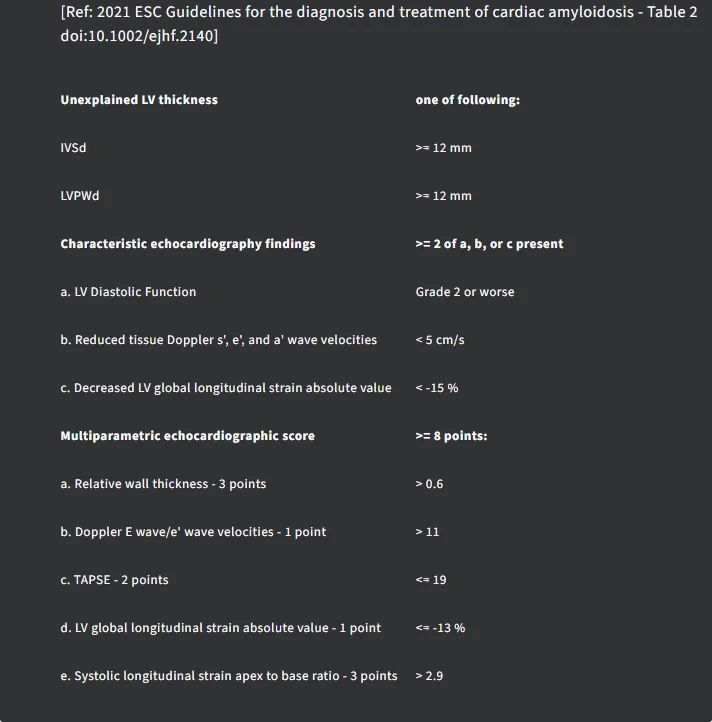
Cardiac Amyloidosis
Hovering over a measurement name displays a preview of the annotation made and underlying measurement. Measurement values that fall outside of available International Reference Guidelines are highlighted in red. You may edit the measurements/suggested conclusions, illustrated in Section 4.3.
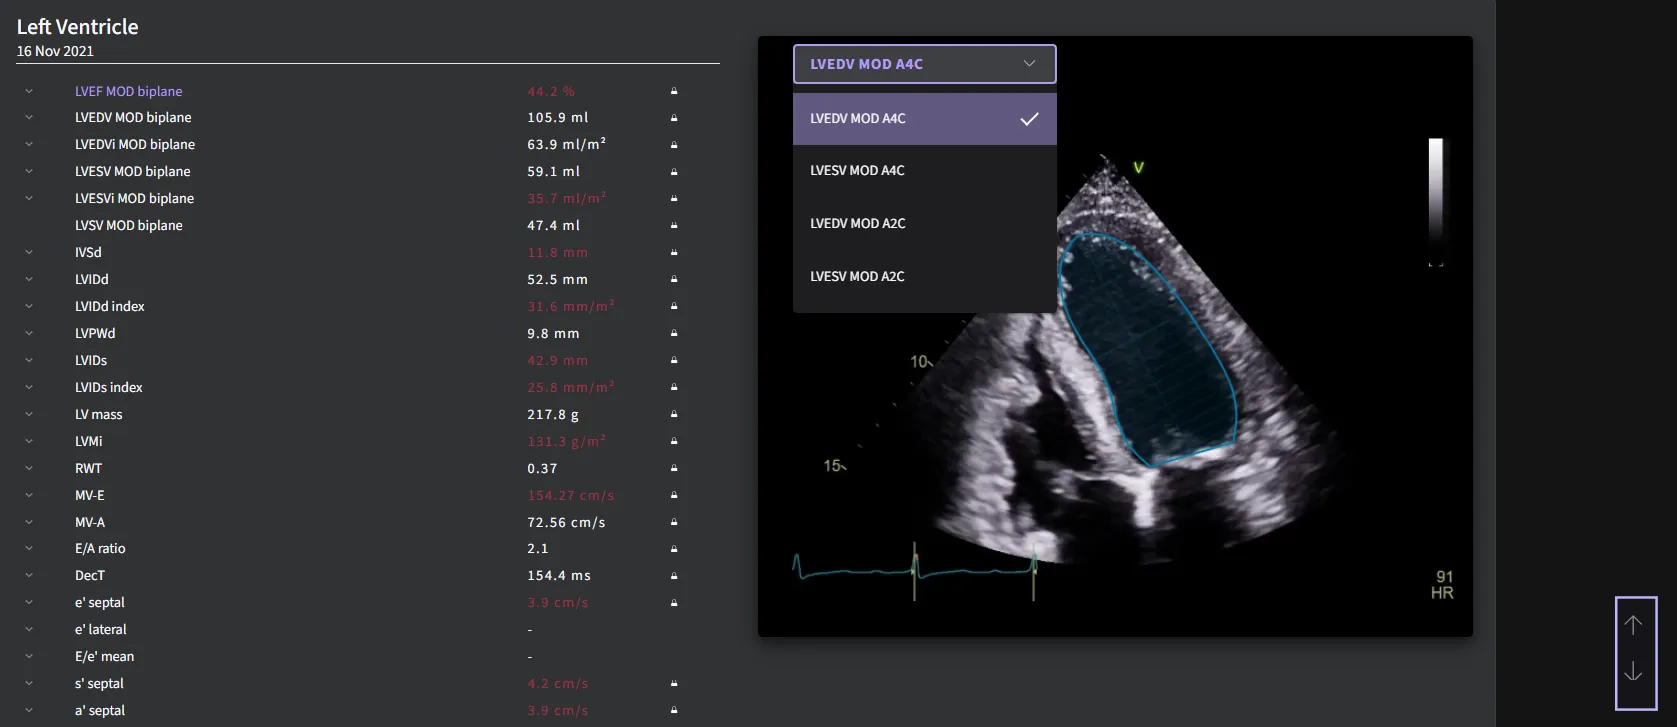
If a measurement value is calculated from more than one annotation, they can all quickly be reviewed by clicking the pull down arrow in the preview image.
Rapidly scroll up and down the report by hovering over the arrows in the side bar.
4.4.3 Measurements Page
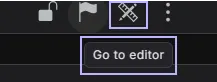
From the report page, you can enter the measurement page by selecting the "Image Overview" icon, any measurement, or the preview panel. By default, the measurement page is displayed in panoramic user interface once a measurement is selected from the report page.
4.4.3.1 Measurement page - Panoramic View User Interface

The default panoramic user interface is composed of four main panels:
- Settings Panel – Provide access to configuration options.
- Image Overview Panel – Displays all acquired images.
- Image Display Panel – Displays the selected DICOM images.
- Report Display Panel – Shows the patient's report.
This user interface can be further expanded to support multiple screen configurations for enhanced flexibility.
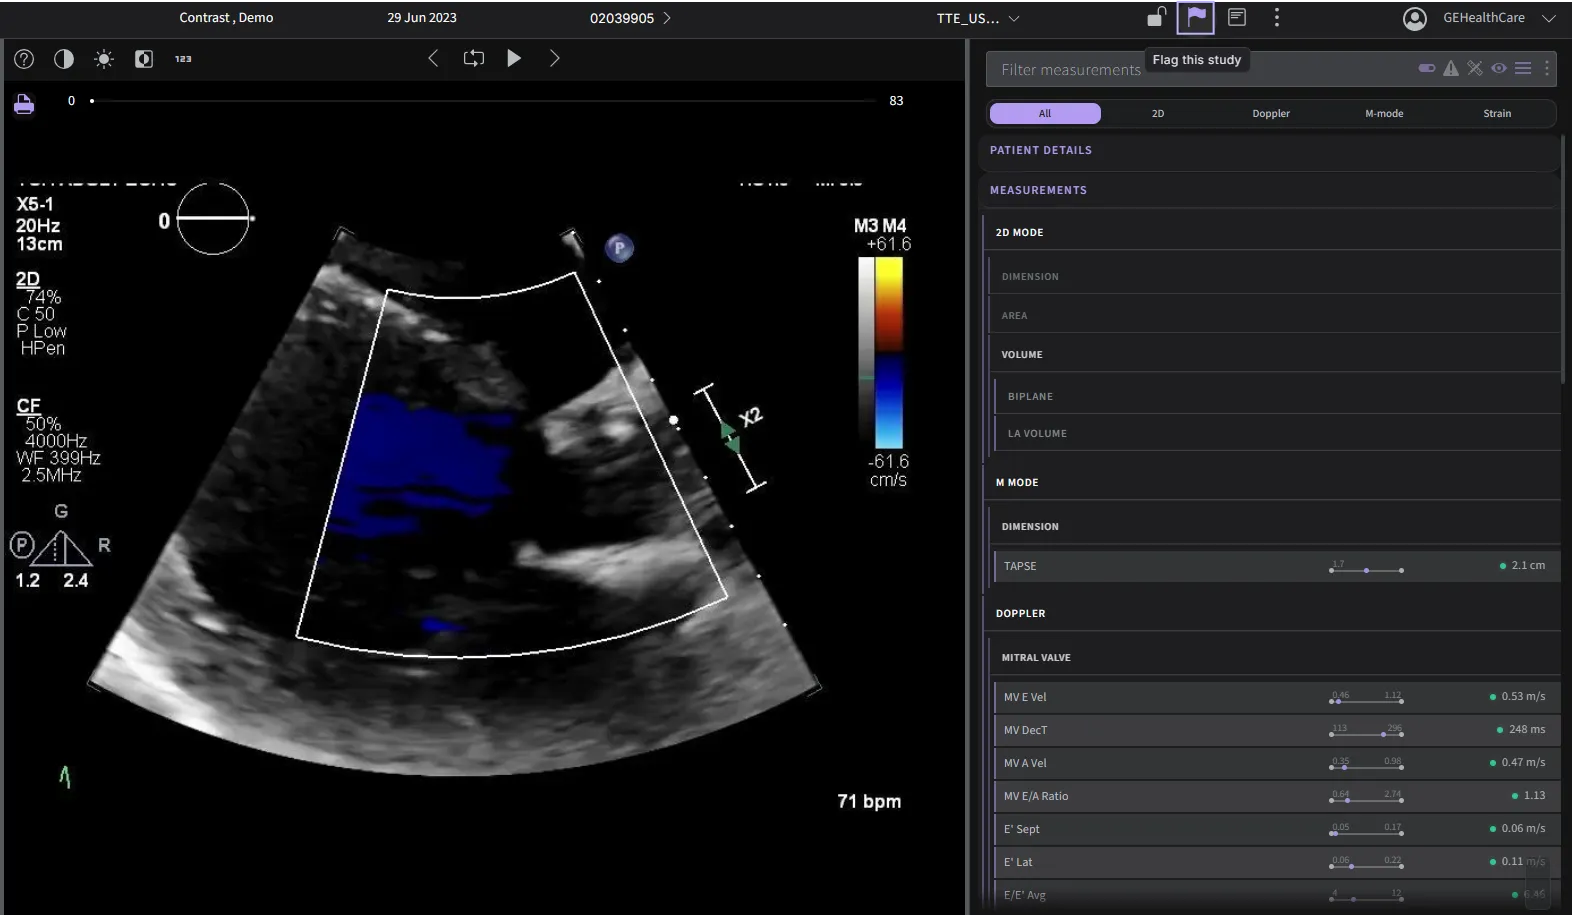
Settings Panel
The settings panel is the default for all users. Additional features will be available based on the user's permission level. For a detailed list of available functions, please refer to section 5.6.11.
Toolbar Overview:

Below is a description of each icon from left to right:
| Icon | Function | Description |
|---|---|---|
| 🔓 | Unapproved | Indicates that the current study or report has not yet been approved. Clicking may allow approval or show status details. |
| 🚩 | Flag this Study | Marks the current study for review, follow-up, or to highlight it for other users. Useful for quality control or pending action. |
| 🖨️ | Print Report | Opens the print dialog to generate a hard copy or PDF version of the report. |
| ✅ | Open Audit Trail | Displays a detailed audit trail showing all changes, actions, and user activity associated with the study. |
| 🔁 | Open Sync Log | Shows the synchronization log for the study, detailing any sync events between systems. Useful for troubleshooting or validation. |
| ⏺️ | Show Processing Timeline | Opens the timeline view showing processing steps and timestamps. |
| 🗂️ | Return to Patient Report | Navigates back to the main patient report page. |
| 👤 | User Profile / Settings | Opens the user menu to access account settings or log out. |
Image Overview Panel
The image overview panel allows customization of displays, advanced sorting and filtering, and view management, including relabeling, reprocessing, deleting views, and creating new exams from DICOM subsets. Filter by view allow search for specific view.
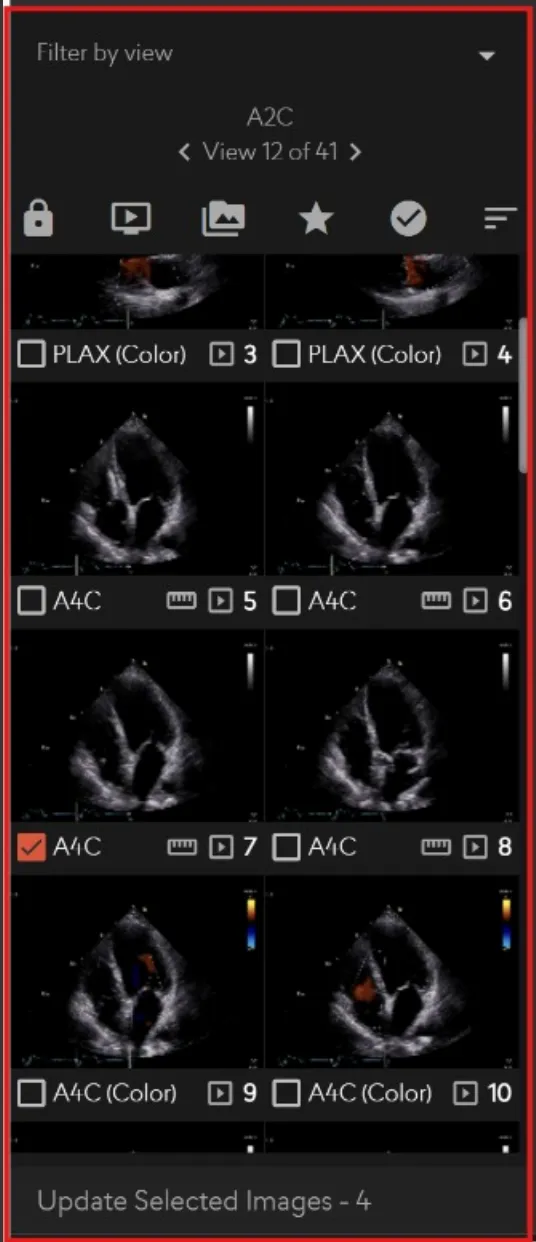
For a detailed list of available functions, please refer to section 5.6.11. Upon selecting "Update Selected Images," the following view will be displayed.
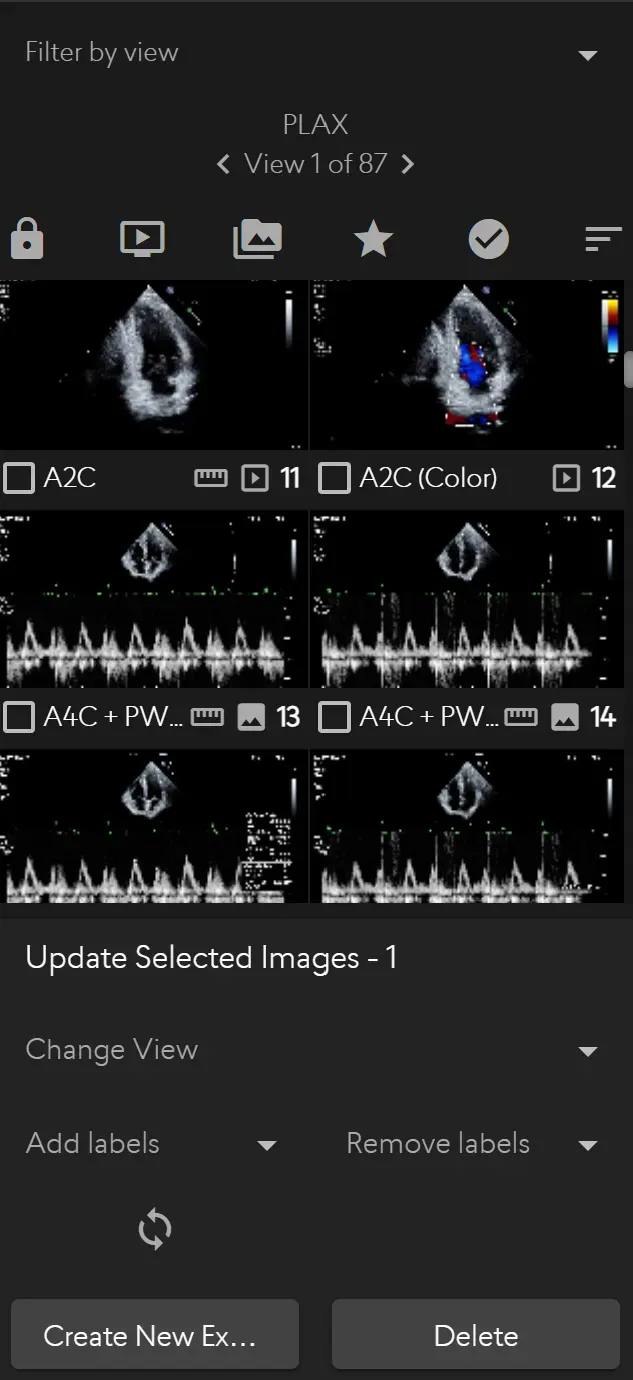
This view allows users to:
- Change View Labels: Select a view and choose a new label from a dropdown menu.
- Remove Labels: Delete unnecessary labels for a cleaner dataset.
- Reprocess Views: Update individual views.
- Create New Exams: Generate a new exam from selected subset of DICOMs.
- Delete Views: Remove specific views from the DICOM dataset.
The panel is fully adjustable to suit your viewing preferences:
- Resize the Panel: Place your cursor between the panels. Click and drag left or right to adjust the number of images displayed in a column.
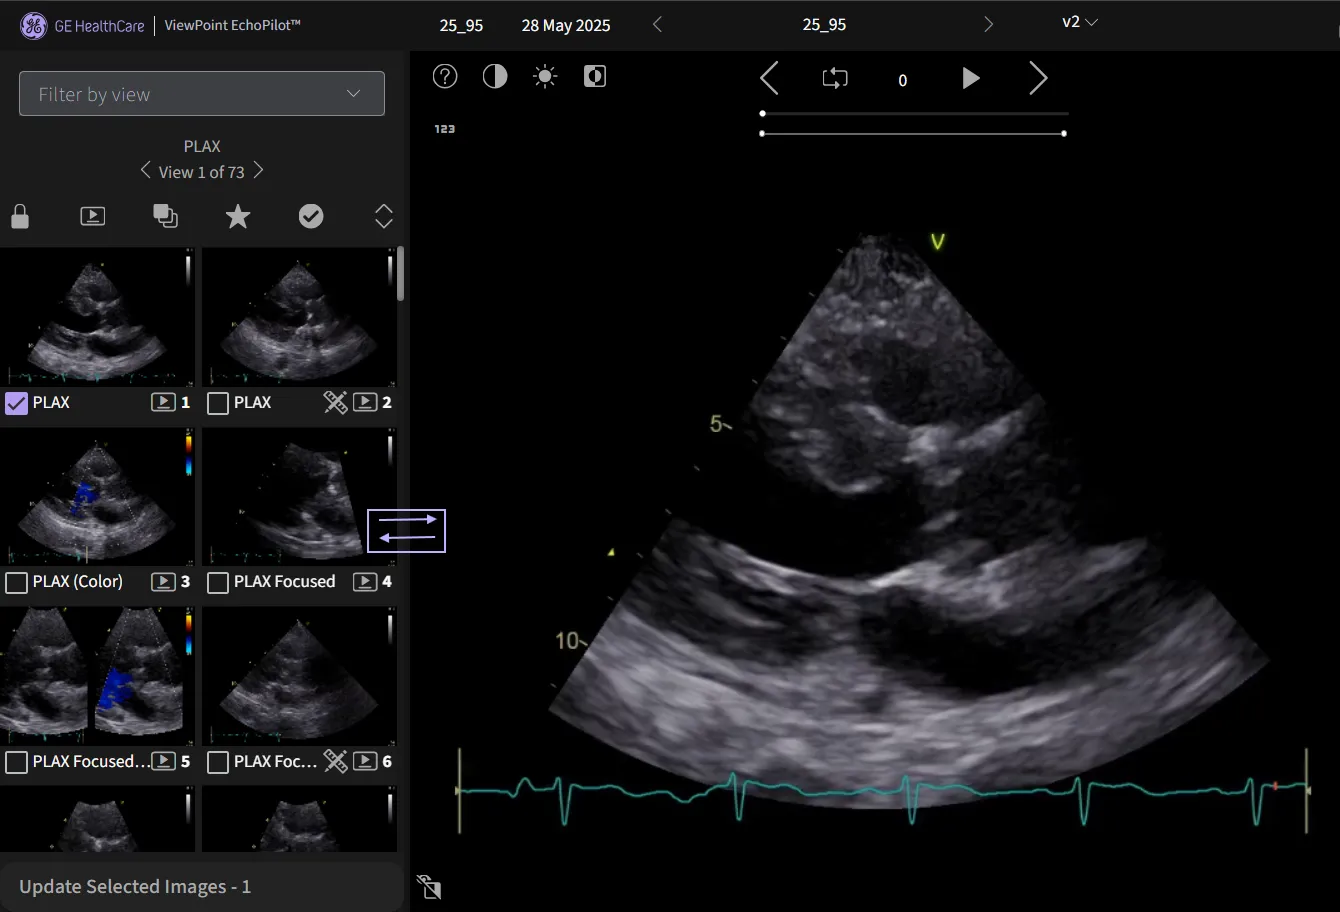
- Lock Image Count: To maintain a consistent layout, even when resizing, you can lock the number of images displayed using the control shown in [2].
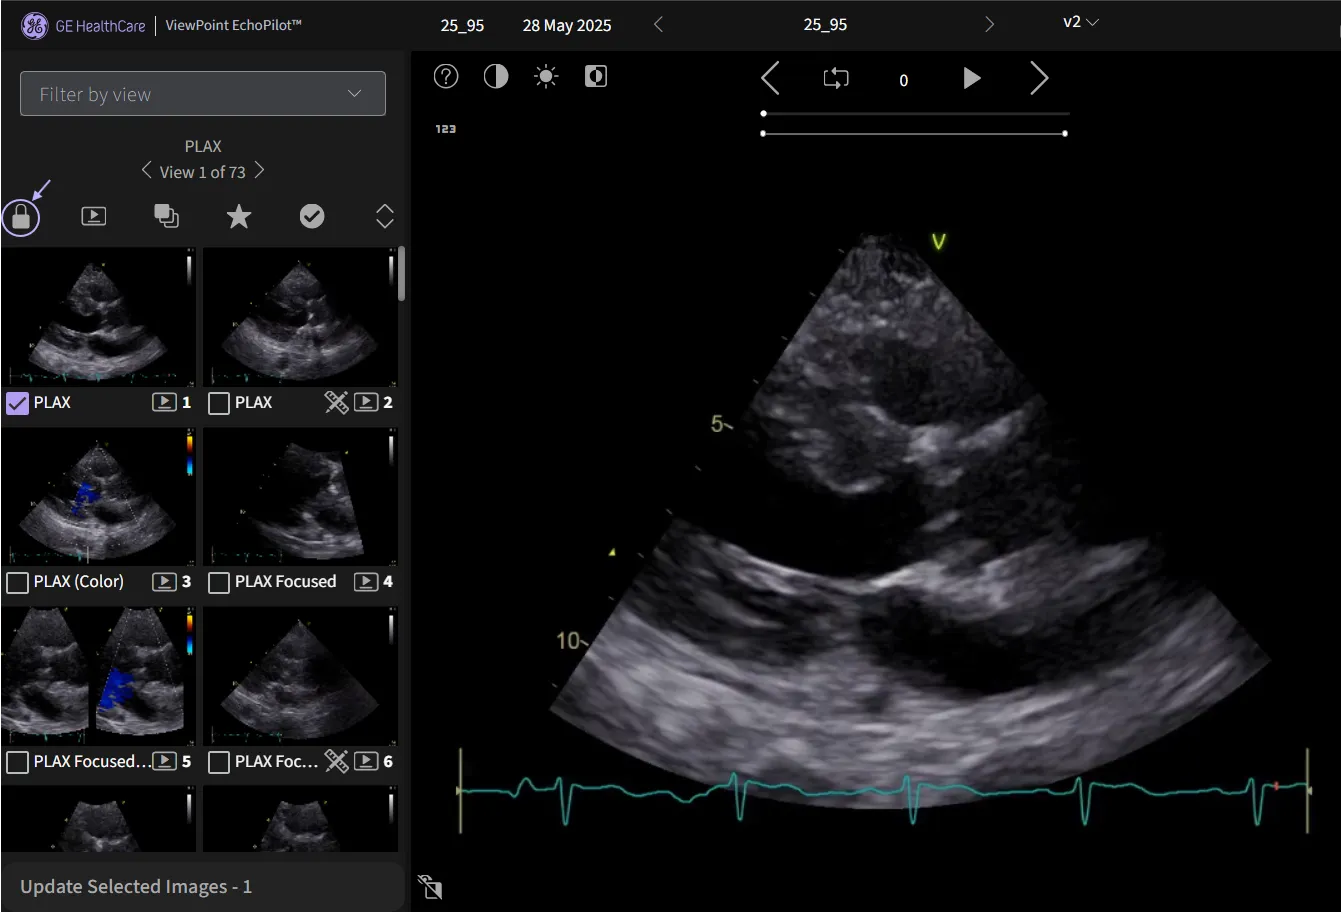
- Collapse the Panel: The panel can also be collapsed entirely to maximize screen space for other content.
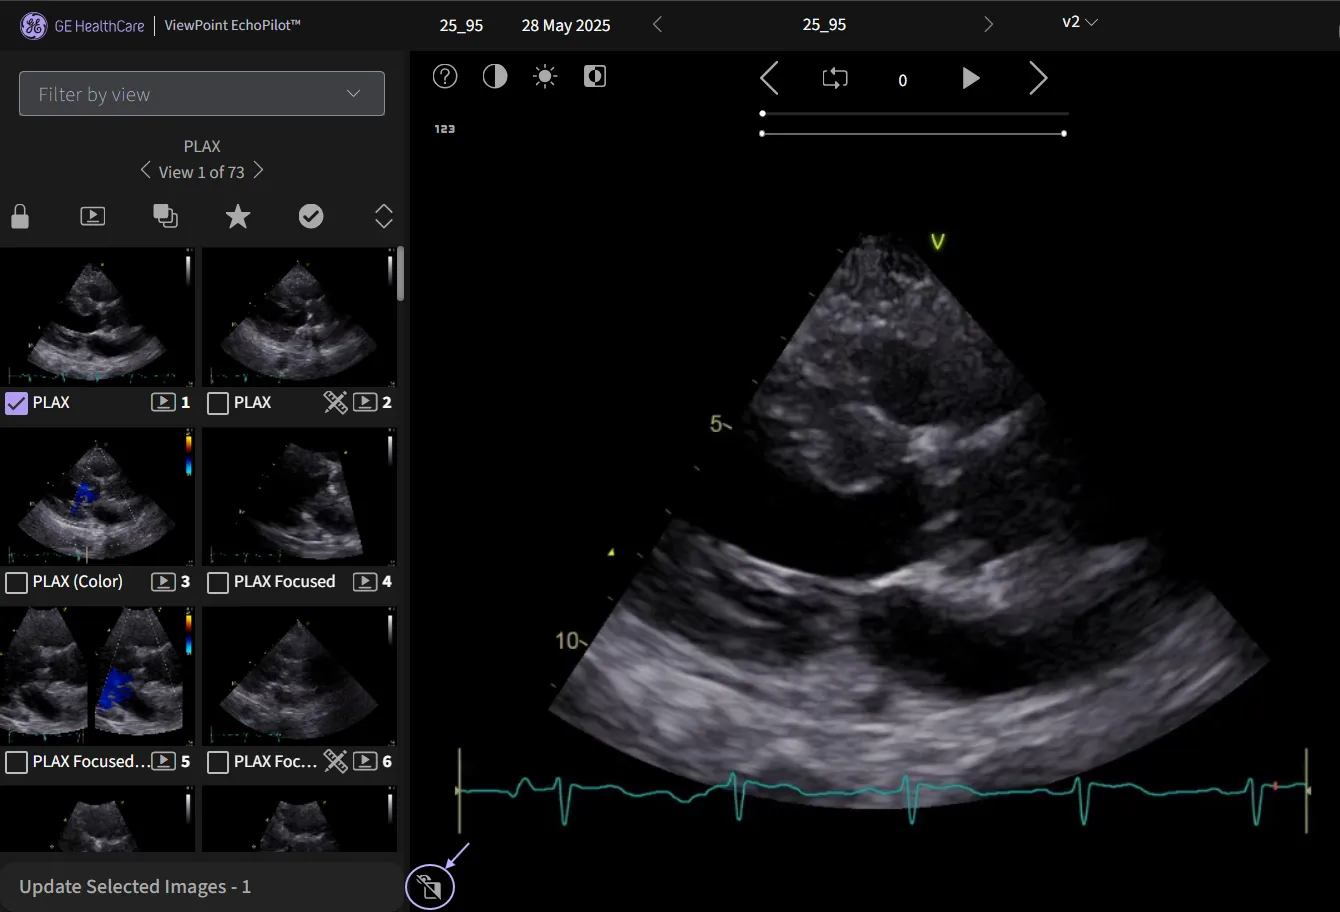
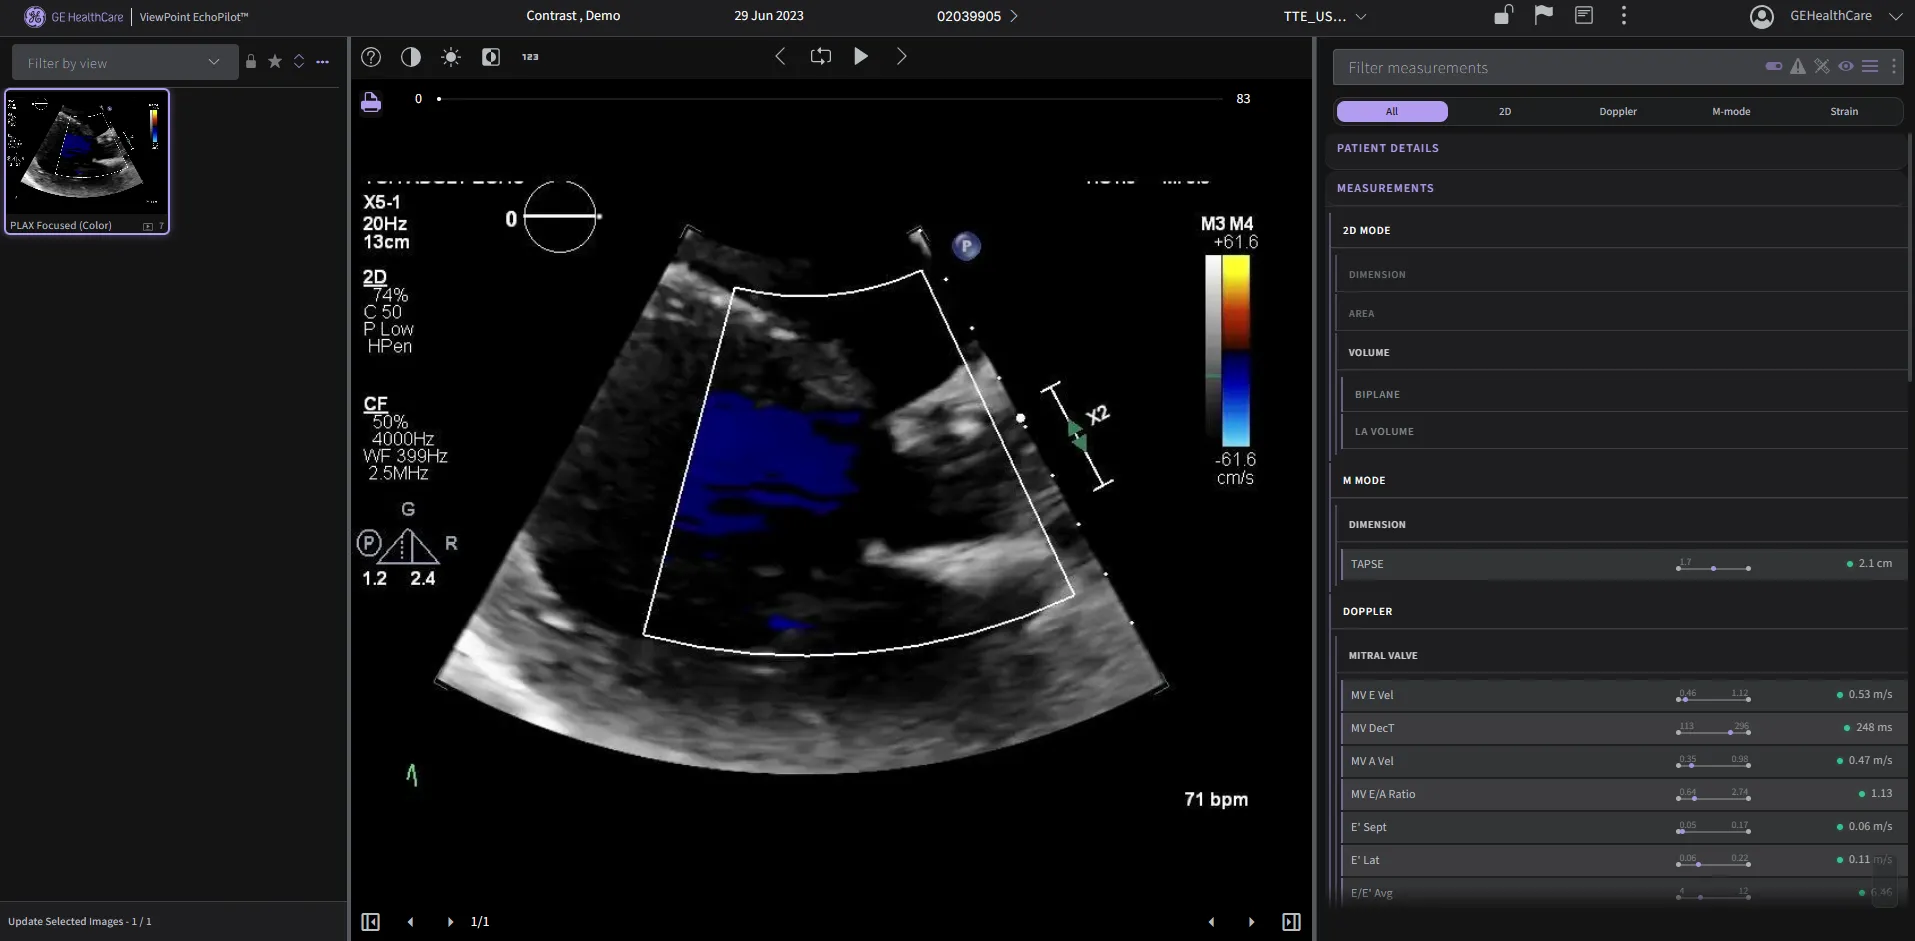
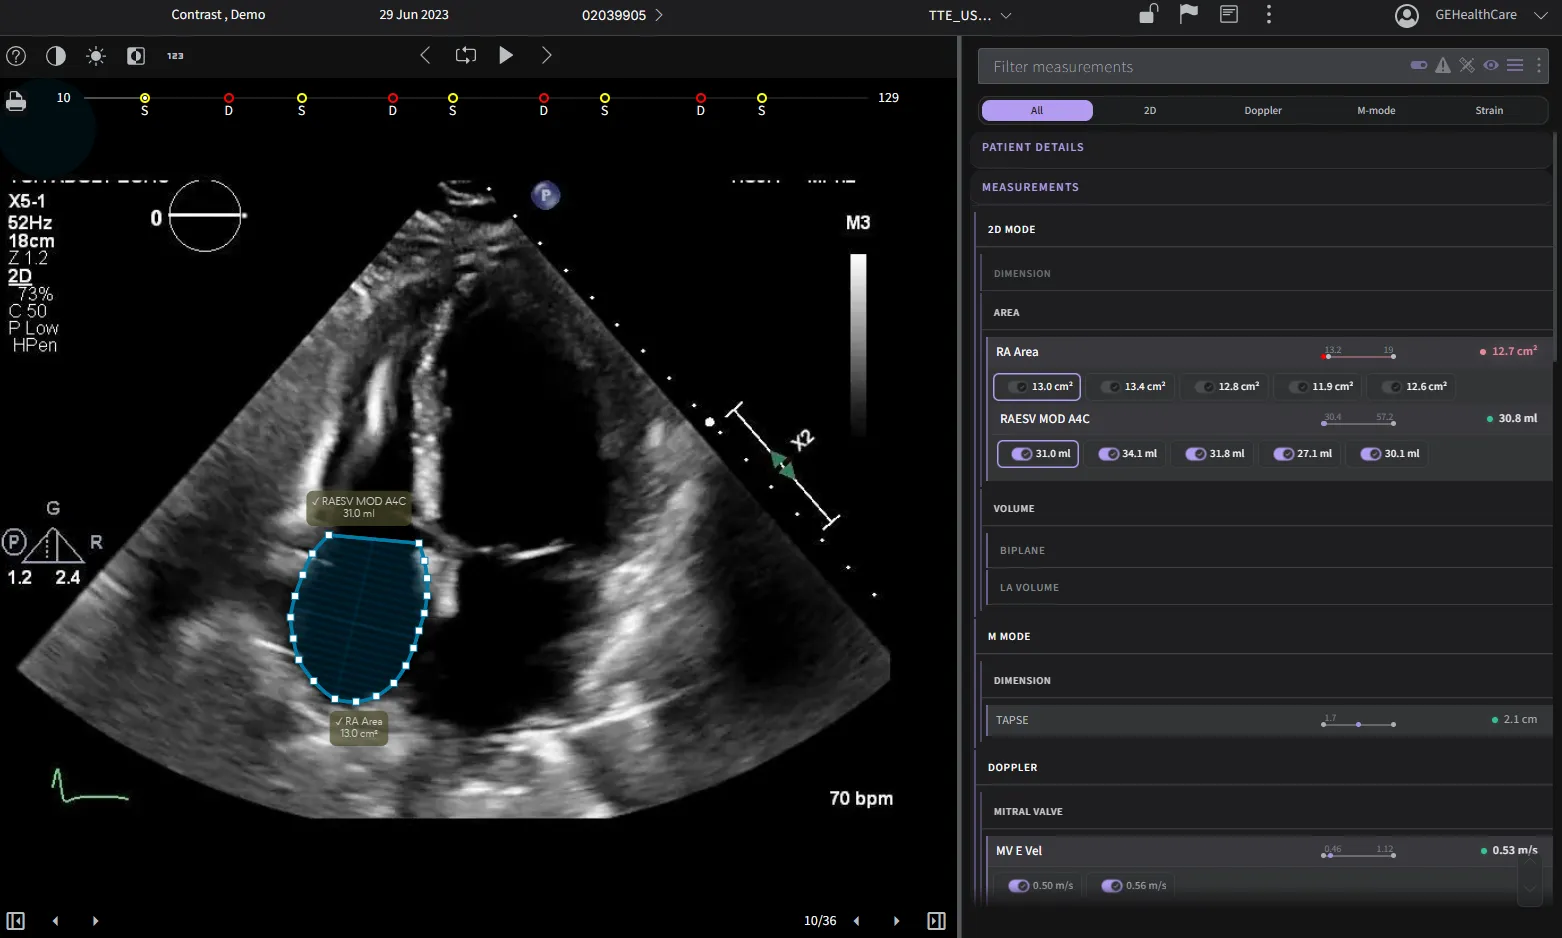
Image Display Panel
Images can be selected from the thumbnails, and the corresponding image will be displayed in the image display panel. You can choose to display images in 2x2, 4x4, or any preferred layout. If you uncheck a box next to a thumbnail, that image will no longer be shown in the image display panel.
The Image Display Panel includes several features to enhance and control the displayed media:
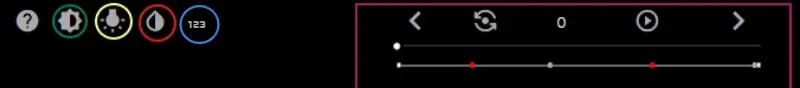
Playback Control
- Play/Pause: This component allows you to play and pause the video.
- Yo-Yo Loop: Continuously cycle the video between specified start and end frames.
- Playback Speed: Adjust the video’s playback speed to your desired pace.
- Frame Navigation: Use the next and previous frame to select specific frames.
- Red dot indicate diastole frames.
- Grey dot indicate systole frames.
Image Adjustment:
- Contrast: Use the slider to adjust the contrast of the displayed image.
- Brightness: Use the slider to modify the image brightness.
Image Filter:
- Sepia Filter: Apply a classic sepia filter to the displayed image.
Display Sequence Number:
- Sequence Number: Toggle this option to show or hide the sequence number overlay on the image.
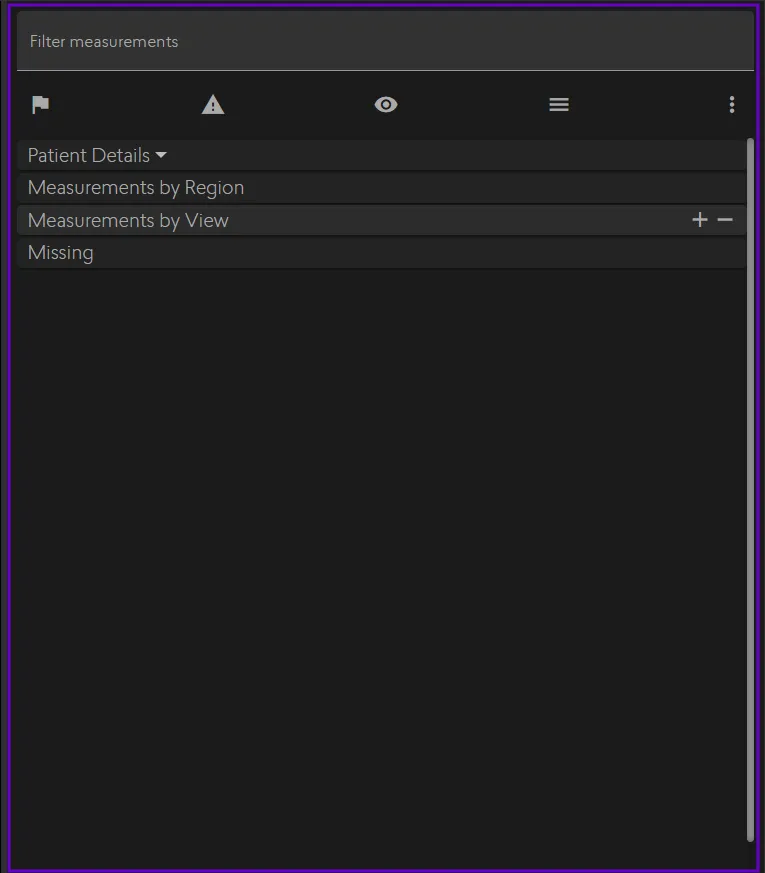
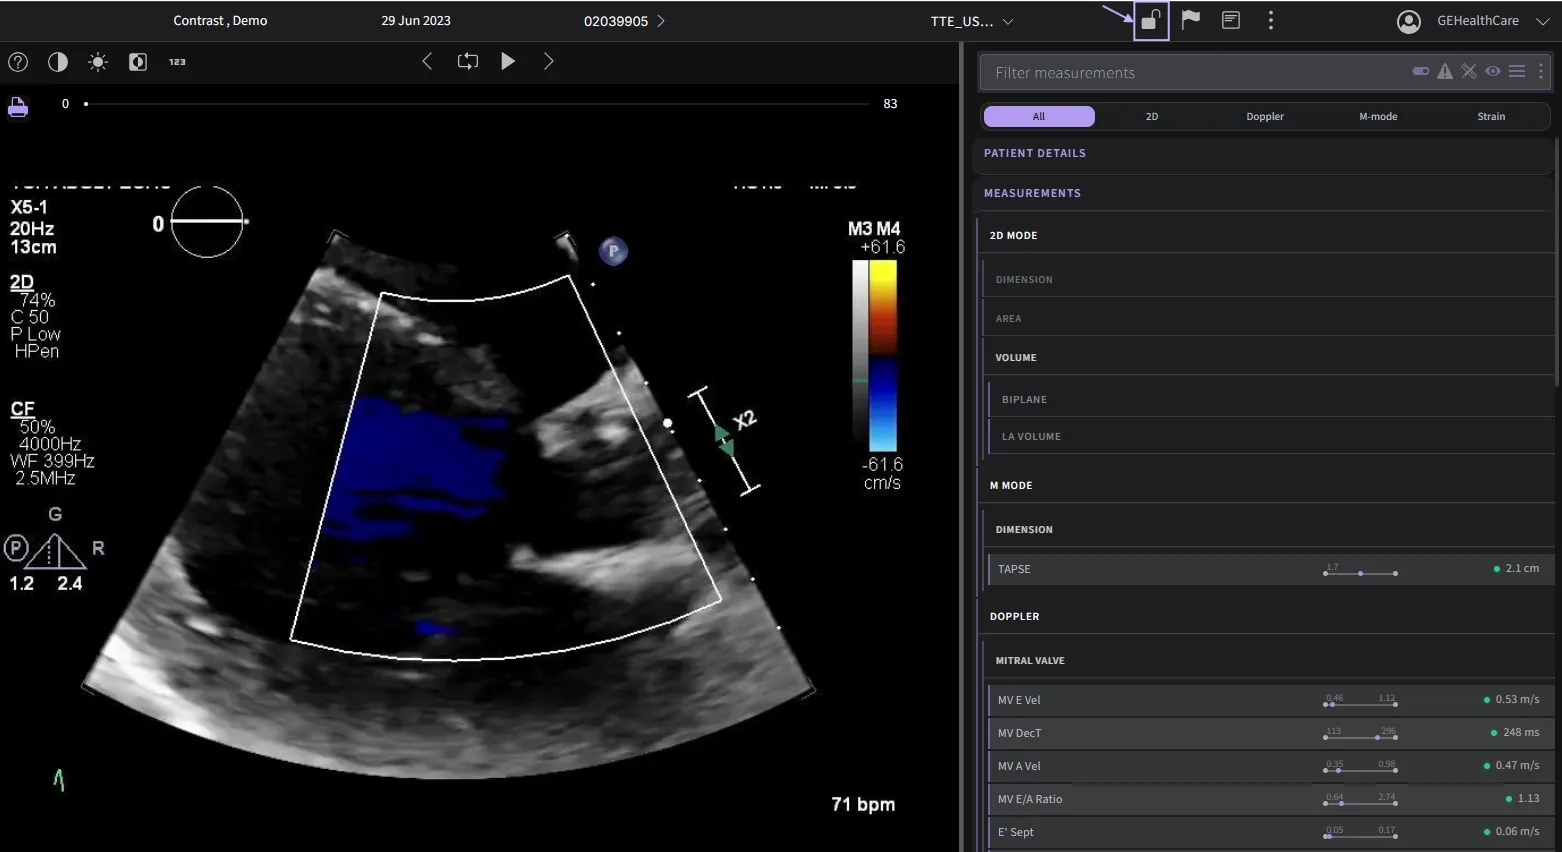
Report Display Panel
This panel includes detailed patient information, measurements by views, and measurements by regions. It also highlights any missing measurements, which are displayed by default to ensure users can easily identify and address incomplete data.
- Filter Measurements Bar
- Use the search bar at the top to filter or search for specific measurements or findings.
- Use the search bar at the top to filter or search for specific measurements or findings.
- Navigation Icons
The following features enhance the report's functionality:
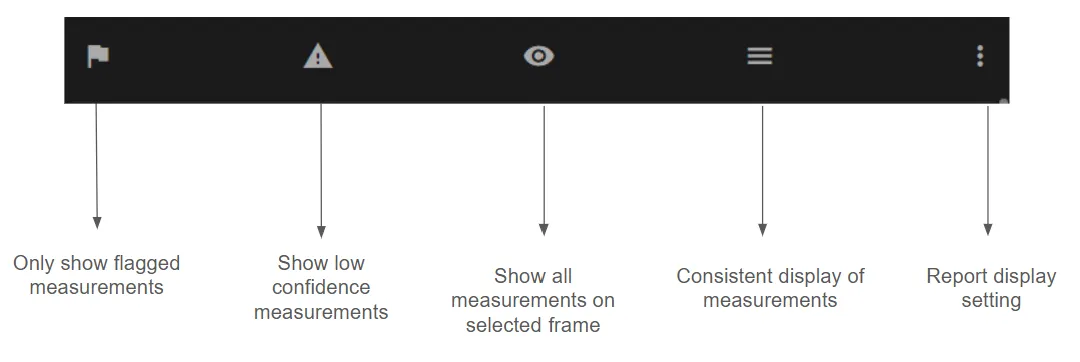
- Flagged Measurements: When enabled, measurements with a flag (high confidence) are displayed.
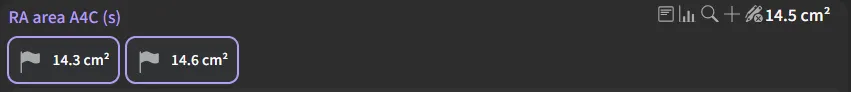
When disabled, measurements without a flag (moderate confidence) are shown for review, allowing users to verify and add them to the report as needed
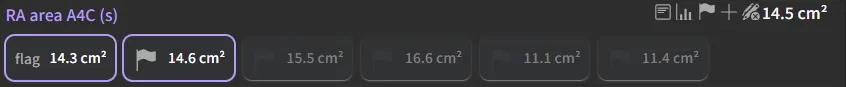
- Low Confidence Measurements: Measurements with an exclamation mark indicate low confidence and are also displayed for review, allowing users to verify and add them to the report as needed.
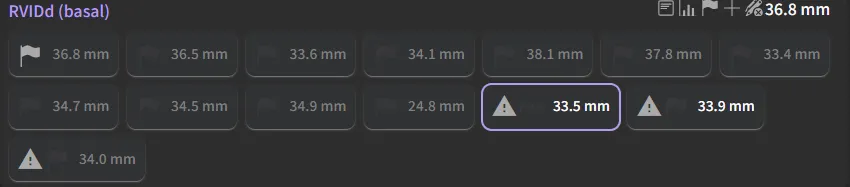
- All Measurements on Selected Frame: Shows all measurements available on the selected frame for a complete view.
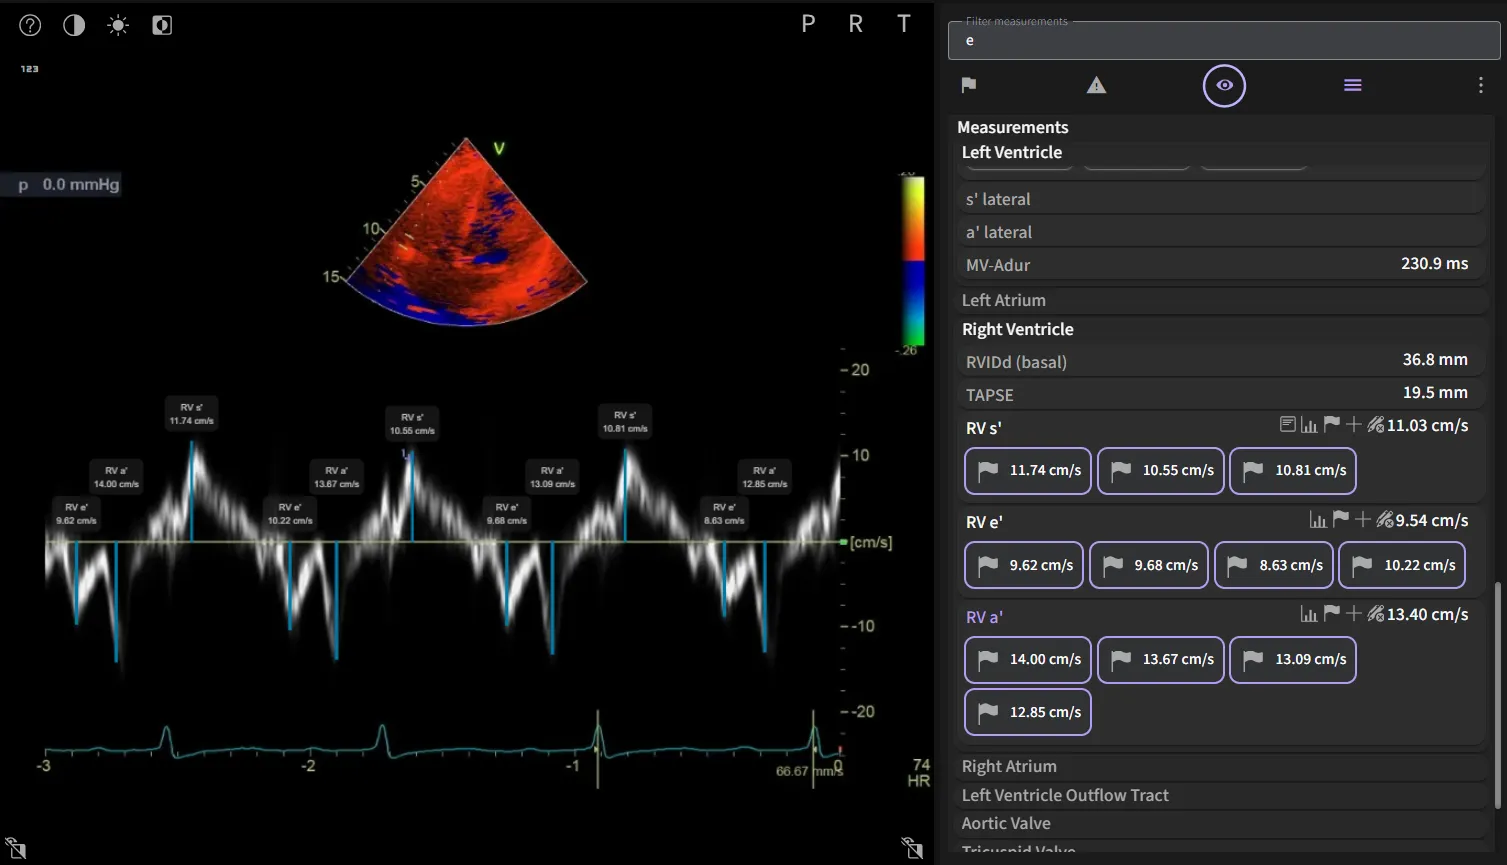
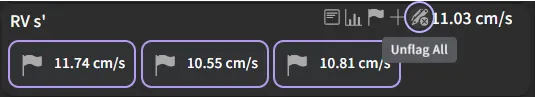
- Unflagging Measurements: To unflag all flagged measurements at once, hover over a flagged value. An icon will appear, allowing you to unflag them with a single click.
- Consistent Display of Measurements: Shows all measurements even if no annotations were done
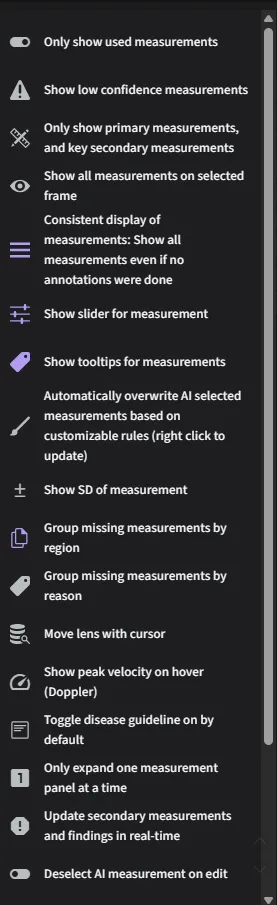
- Report Display Settings: Customizable options to tailor the report layout:
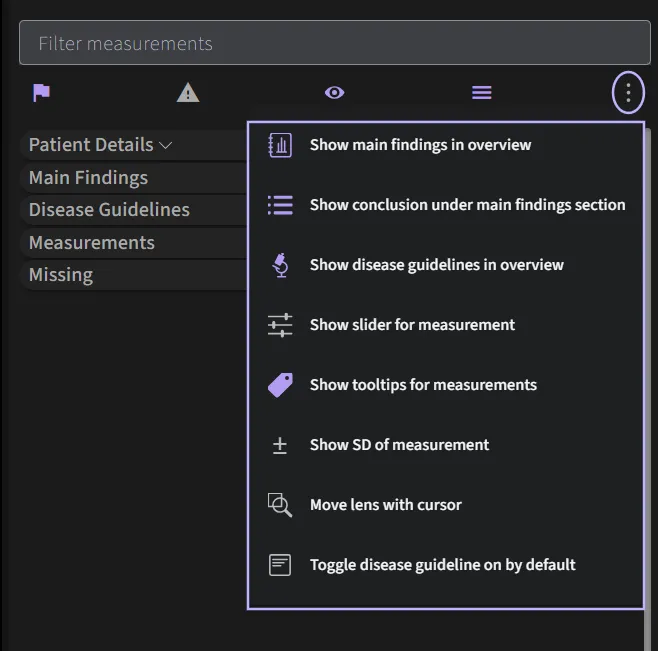
- Main Finding in Overview: Displays the main findings in the overview section.
- Conclusion Under Main Finding: Positions the conclusion directly under the main findings for clarity.
- Disease Guidelines in Overview: Includes relevant disease guidelines in the overview section.
- Measurement Slider: Shows a slider for the normal range of measurements.
- Tooltips for Measurements: Provides tooltips for better understanding of measurement data.
- Standard Deviation of Measurements: Displays the standard deviation for each measurement.
- Lens Movement with Cursor: Allows users to move the lens using the cursor for better focus.
- Toggle Disease Guideline On by Default: Ensures the disease guideline is enabled by default for convenience.
- Flagged Measurements: When enabled, measurements with a flag (high confidence) are displayed.
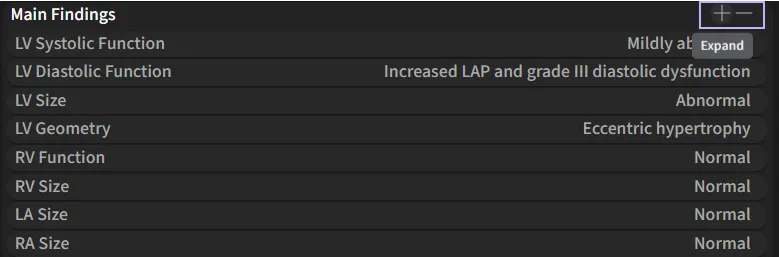
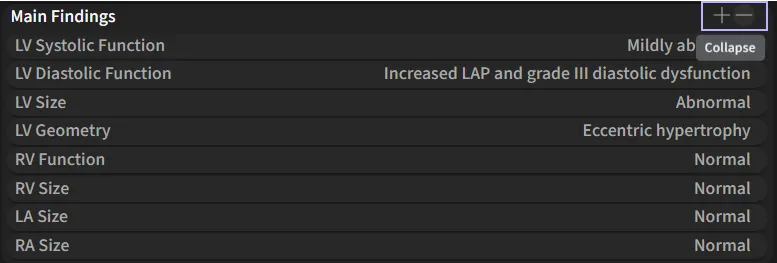
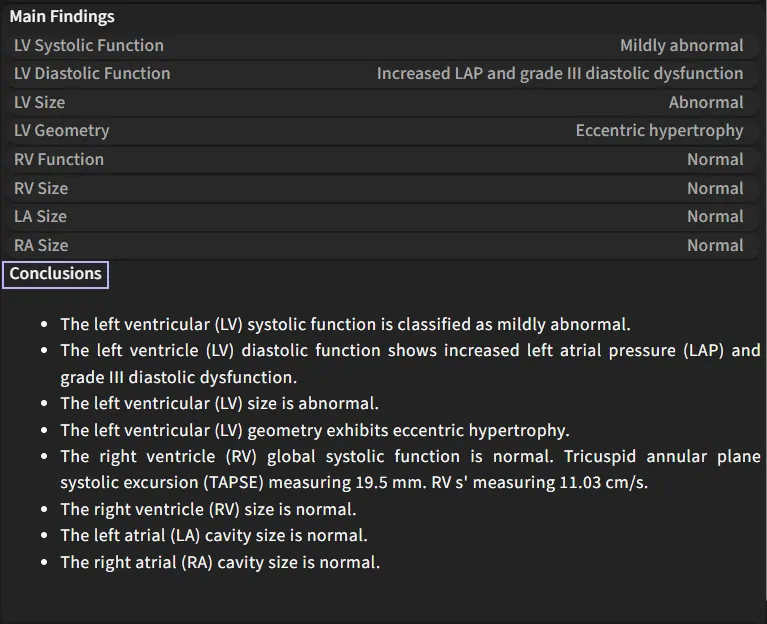
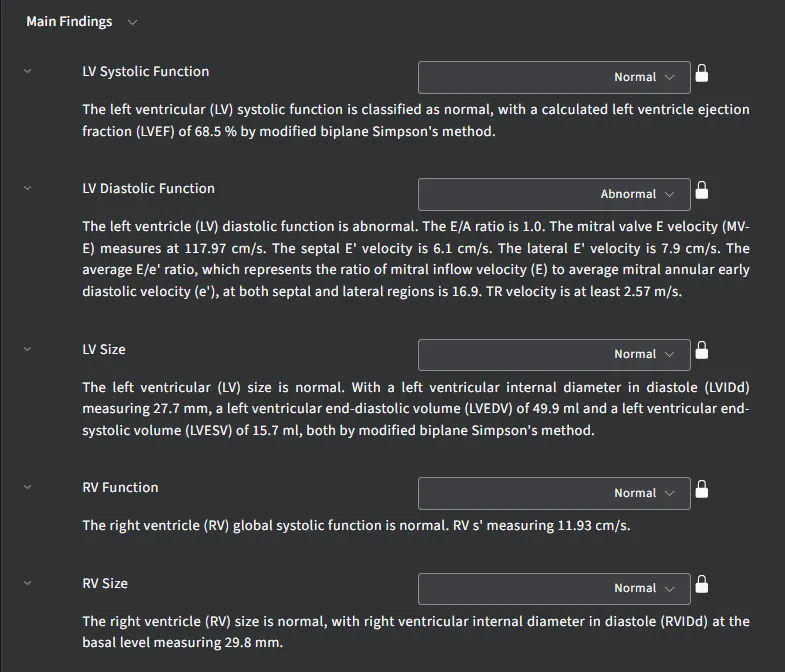
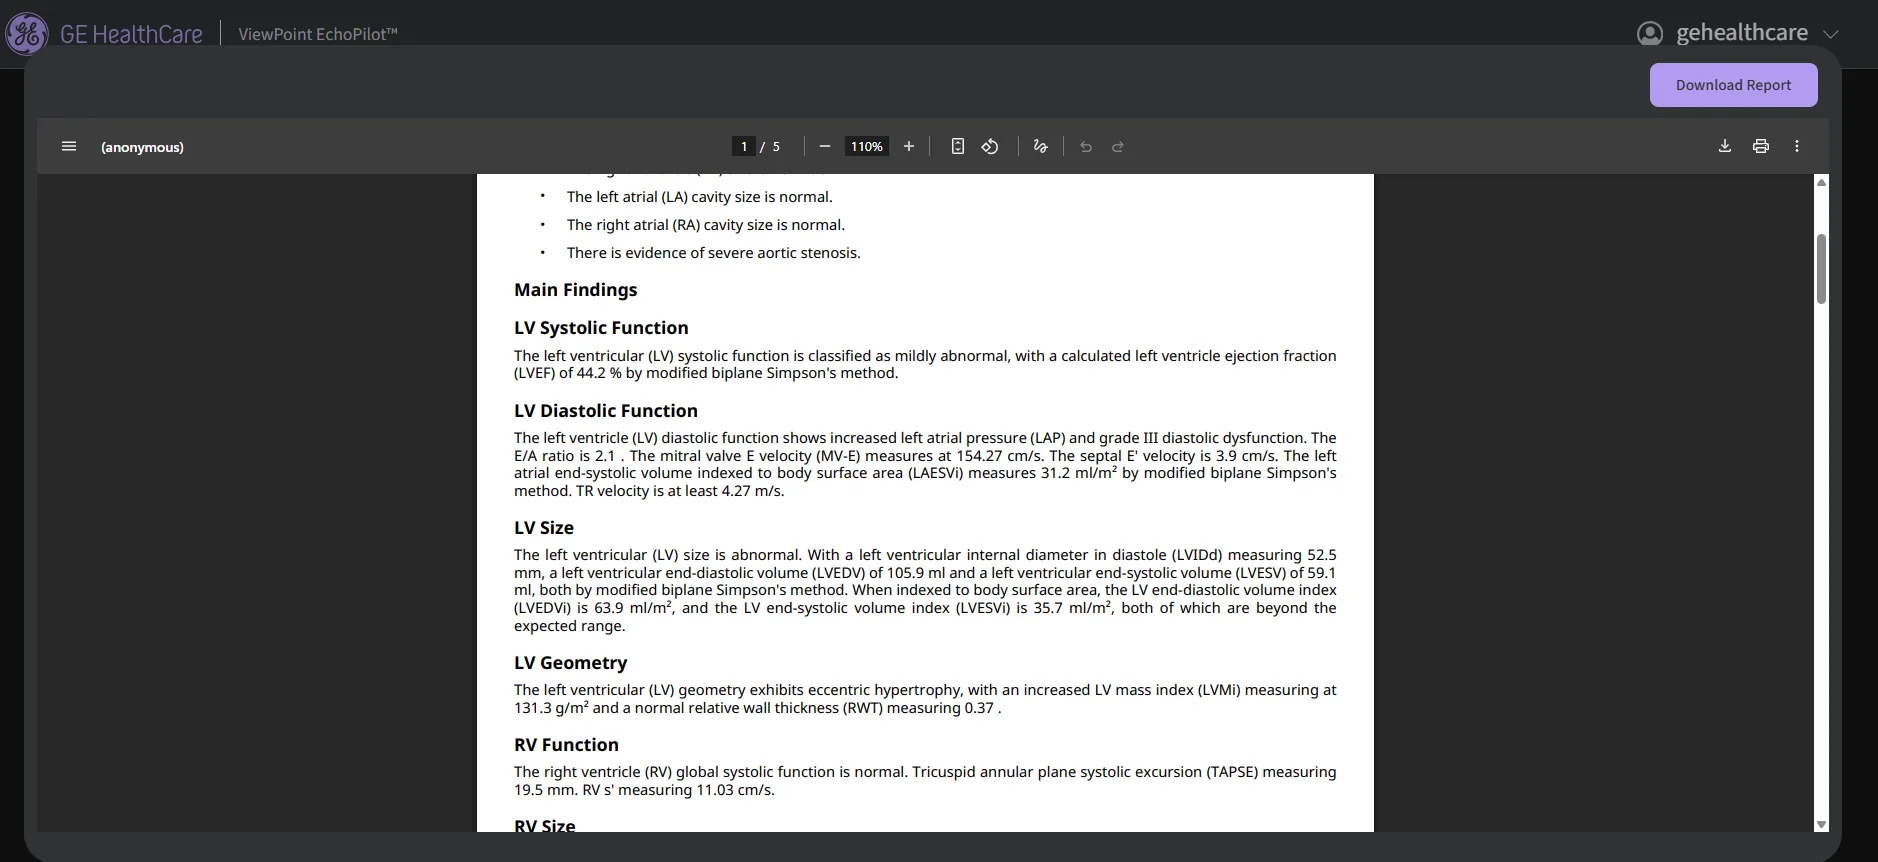
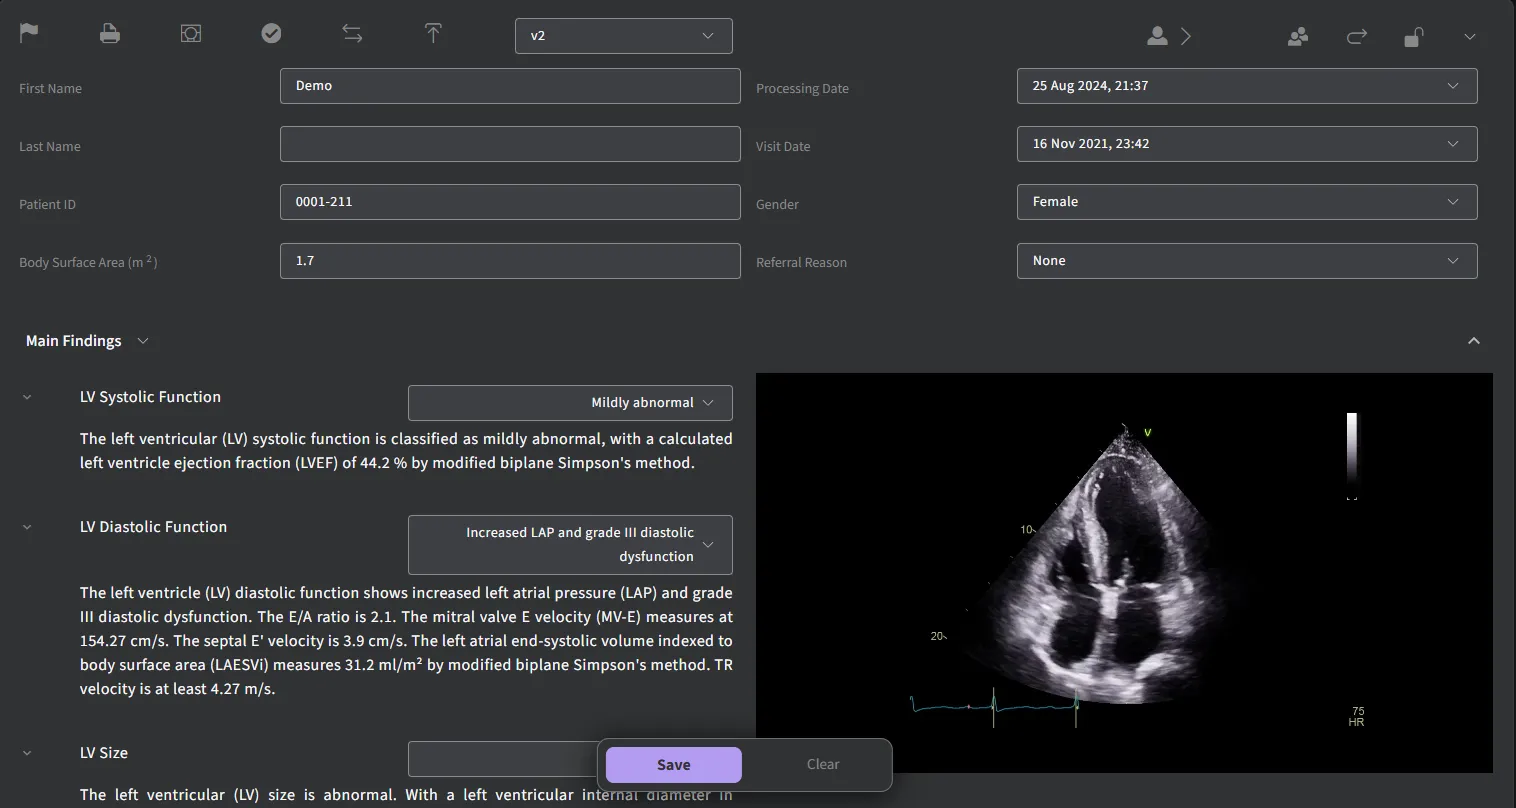
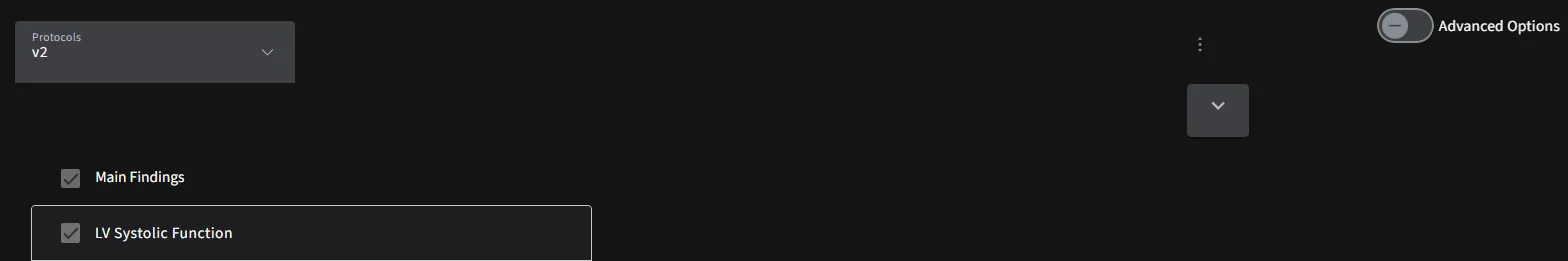
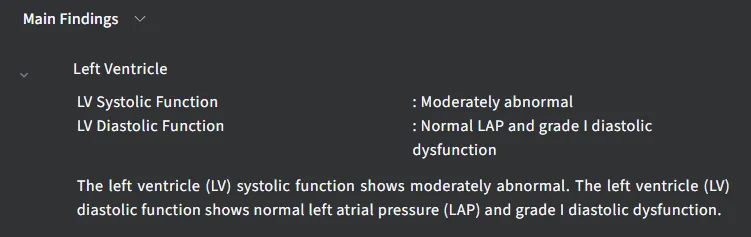
- Main Findings Section
The main findings section provides an auto-generated summary of key measurements and results. The content displayed is tailored based on the protocol selection configured within your user account. This section includes functional and structural assessments of the heart.
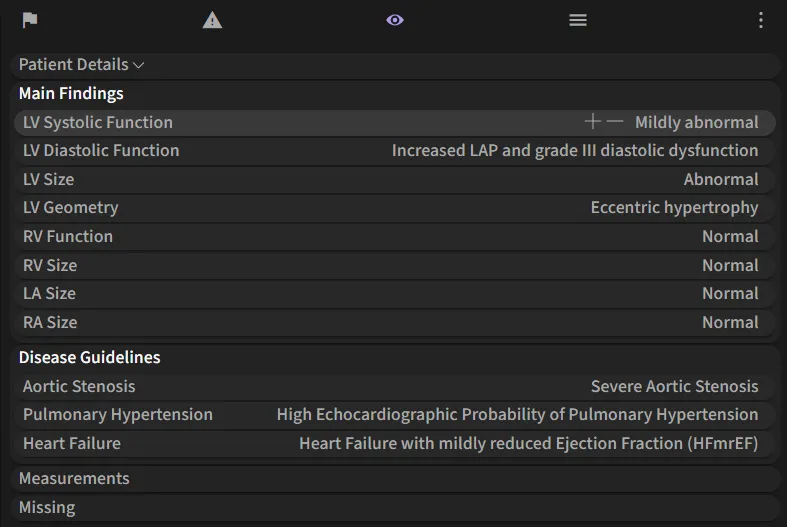
Click + to expand and view detailed measurements and guidelines. Click - to collapse the section.
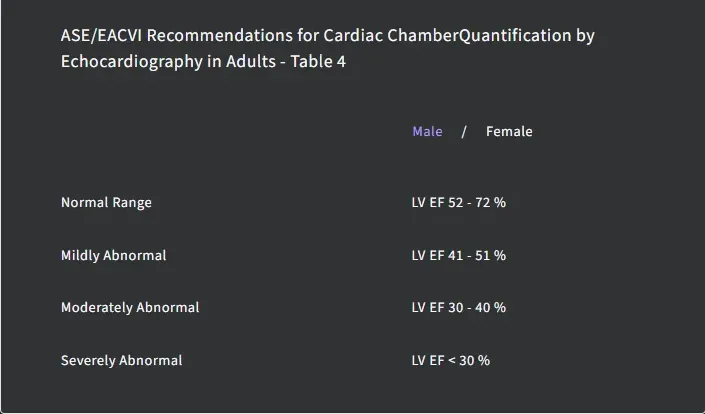
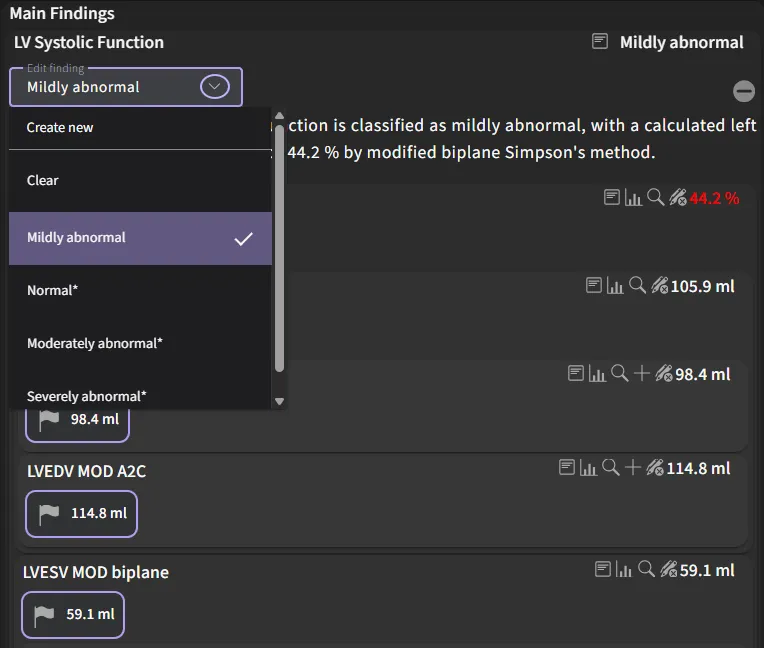
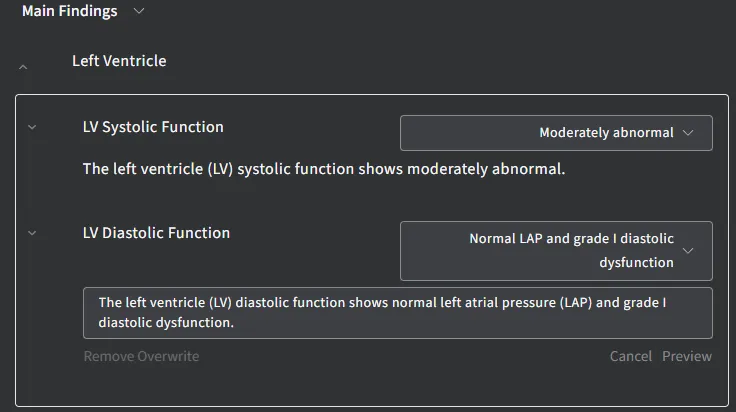
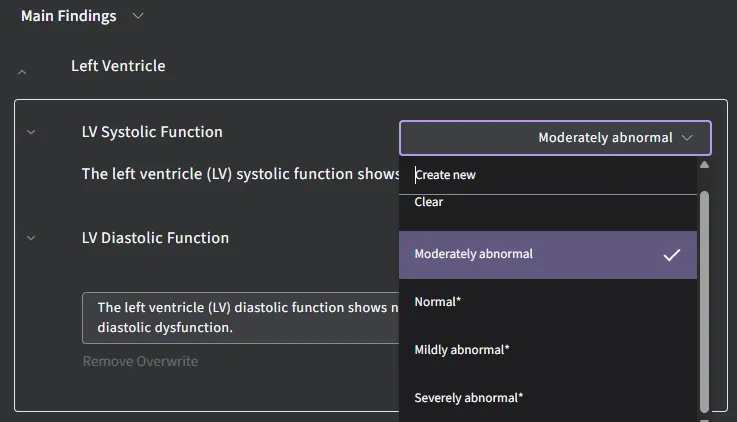
Edit Findings
- To modify a finding:
- Click on the dropdown menu under the selected parameter (e.g., LV Systolic Function).
- Choose from available classifications such as Normal, Mildly Abnormal, Moderately Abnormal, or Severely Abnormal.
Paragraph Editing
- For detailed edits, press Ctrl + Left Click on the desired paragraph to enable direct editing.
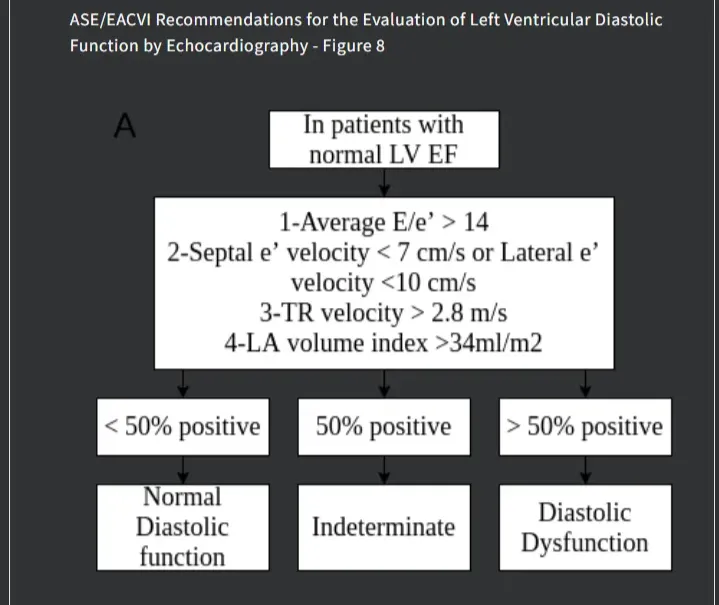
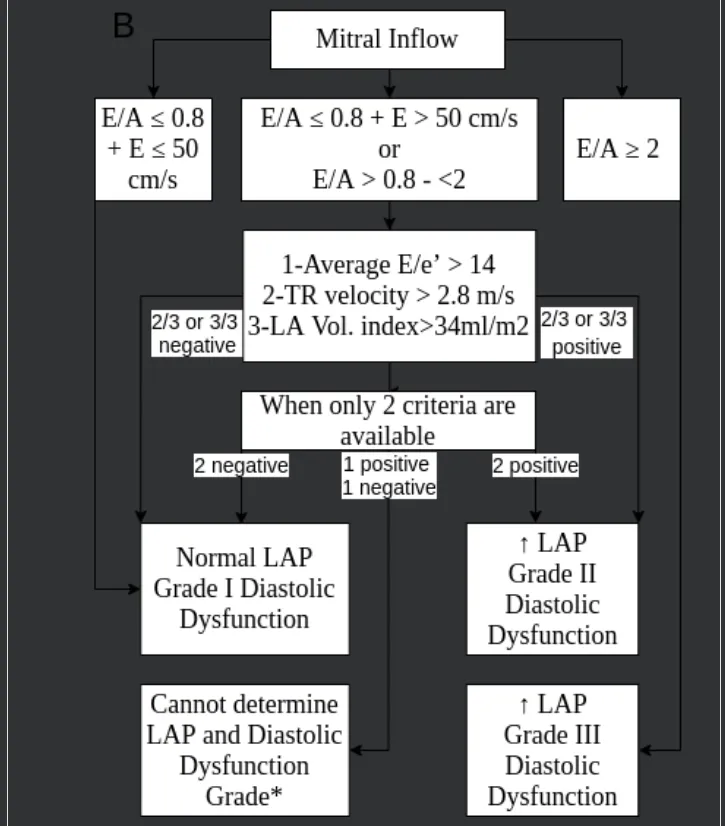
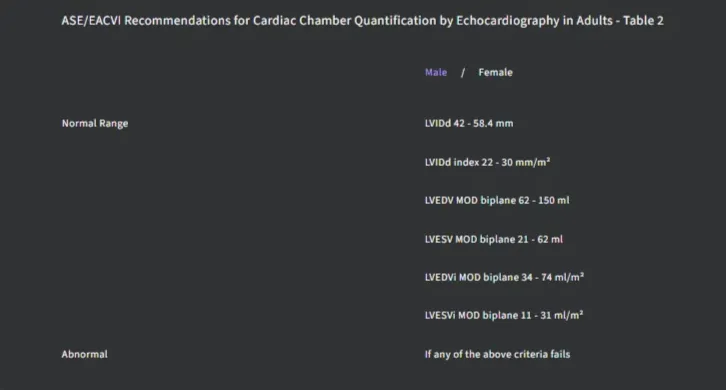
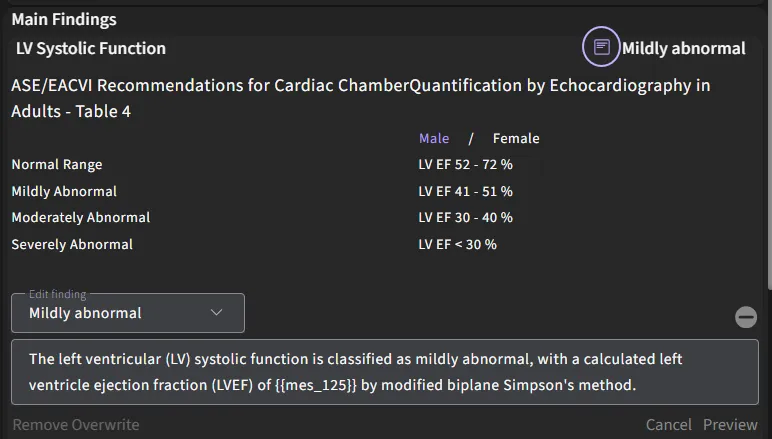
Disease Guideline Integration
- Toggle on the guideline icon to display the ASE/EACVI Guidelines. These guidelines provide reference ranges and classification criteria for measurements, ensuring clinical accuracy.
- To modify a finding:
- Additional Sections
- Conclusions: Summarizes findings for quick interpretation. The conclusion section within the report can be enabled or disabled according to your preference.
- To toggle this setting:
- Navigate to the Settings page.
- Go to Report and Print Settings → Report → Data Presentation and Display.
- Toggle "Show short conclusion in report" on or off to control whether the conclusion appears in the final report.
- Disease Guidelines: All findings within the Disease Guideline can be added to the “Main Findings” section
- Select "Create a finding" to move it up to the Main Findings section.
- To remove a finding from the report, select "Remove finding".
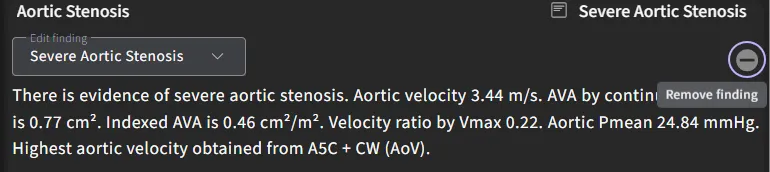
- Select "Create a finding" to move it up to the Main Findings section.
- Measurements by Region: Break down measurements based on region or imaging view. For detailed instructions on how to edit, add or delete measurements for 2D, Doppler and GLS, please refer to sections 5.6.5 to 5.6.8 in the user guide. These sections will guide you through the steps for modfiying measurements within those categories.
- Missing: Flags missing measurements for attention.
4.4.4 Supplemental Modules
For users with access to supplemental modules that uses AI to identify patients who need additional follow up for the various disease(s) but do not replace current standards of care.
4.4.4.1 Cardiac Amyloidosis - AI
When echocardiogram studies are sent to the ViewPoint EchoPilot software, it will process the A4C views before the report is generated. Within the generated report, ViewPoint EchoPilot will mention whether a patient study is “Suggestive of Cardiac Amyloidosis” when the model detects the disease with a sufficiently high level of confidence. This result is presented to the user under the Main Findings section illustrated below,
When the model is uncertain, the generated report will mention “Equivocal” for Cardiac Amyloidosis
When the model does not observe any visual patterns to suggest Cardiac Amyloidosis, the generated report will mention “Not Suggestive of Cardiac Amyloidosis based on visual patterns observed” along with the emphasis that it does not mean the total replacement of a thorough clinical evaluation.
ViewPoint EchoPilot serves as a decision support tool to guide users in their clinical decision-making as they review and finalize the patient study for CA. Clinicians will see a potential CA finding flagged when opening a report, which they can clear the findings or change the decision then approve or reject.
4.5 Tailor report content
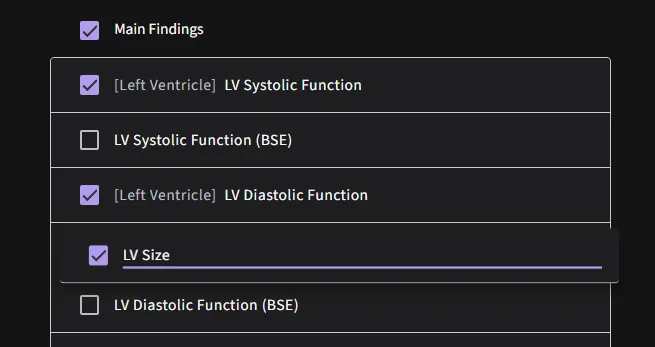
The report content can be tailored to your specific needs and preferences, ensuring that you see only the most relevant information. The main findings of the report can be hidden by selecting the dropdown arrow, allowing you to navigate to the list of automated measurements faster.
Show findings:
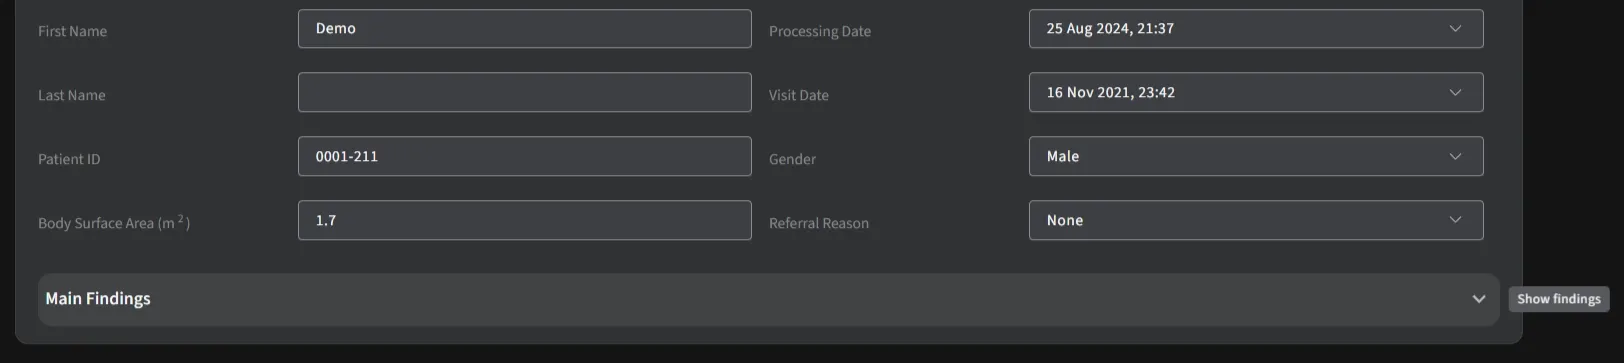
Hide findings:
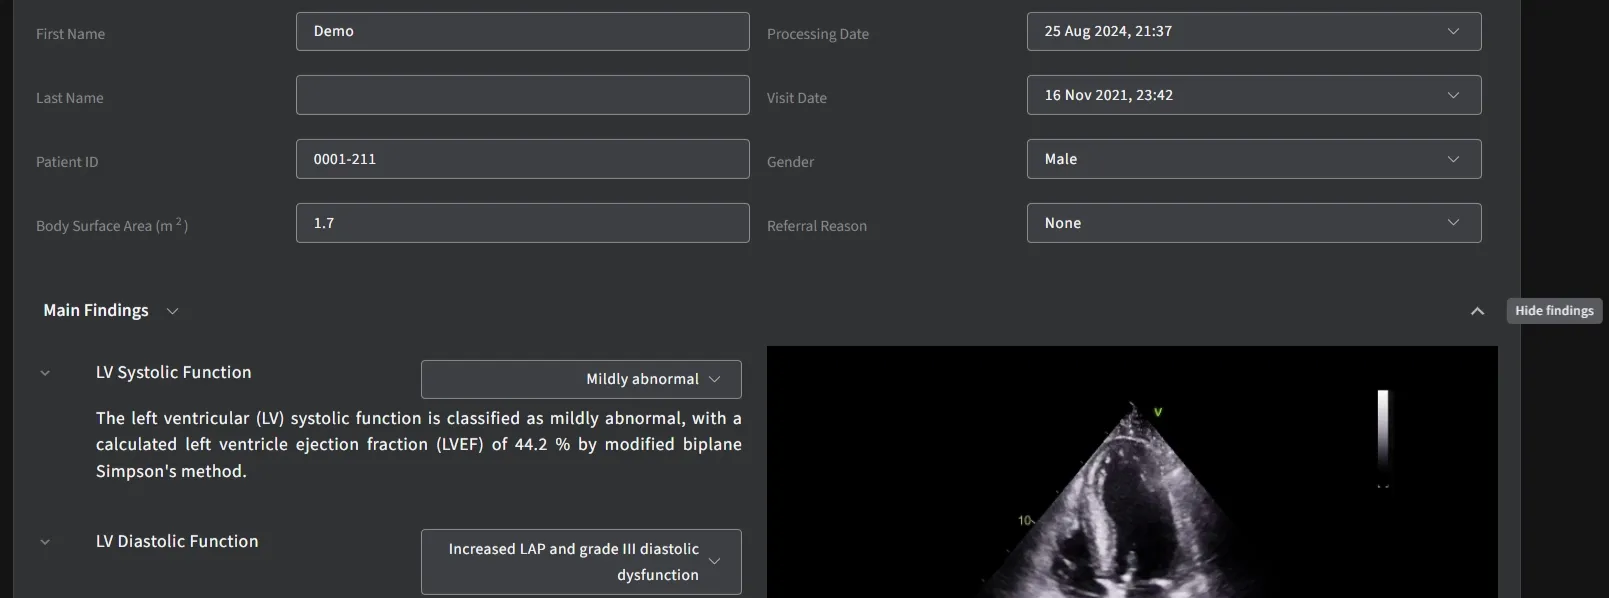
Locate the dropdown box next to the “Main Findings”. Click on the dropdown box to view the list of available findings. Select the findings you wish to include while viewing by clicking on the appropriate options from the list. The report page will automatically update to display the selected findings.
4.5.1 Disease Guideline
All findings within the disease guideline can be added to the main findings by clicking on the hamburger icon at the side and selecting the option "Create a finding" to move it up to the main findings section. You can also select "Clear" to remove the finding from the report.
4.6 Tailor editor page content
Enter customize mode to change which elements are visible in the Editor Page and to set your favorite measurement views for quicker access during review.
5 Advanced Functions
5.1 Report Features
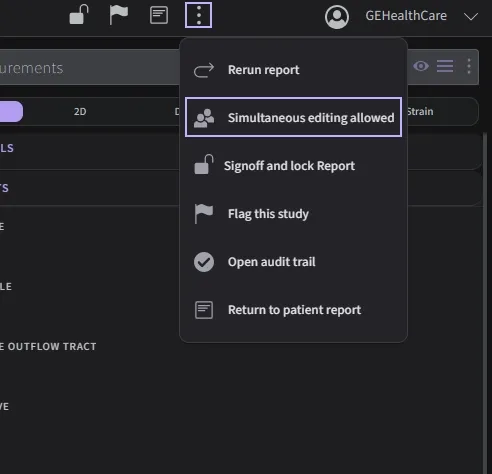
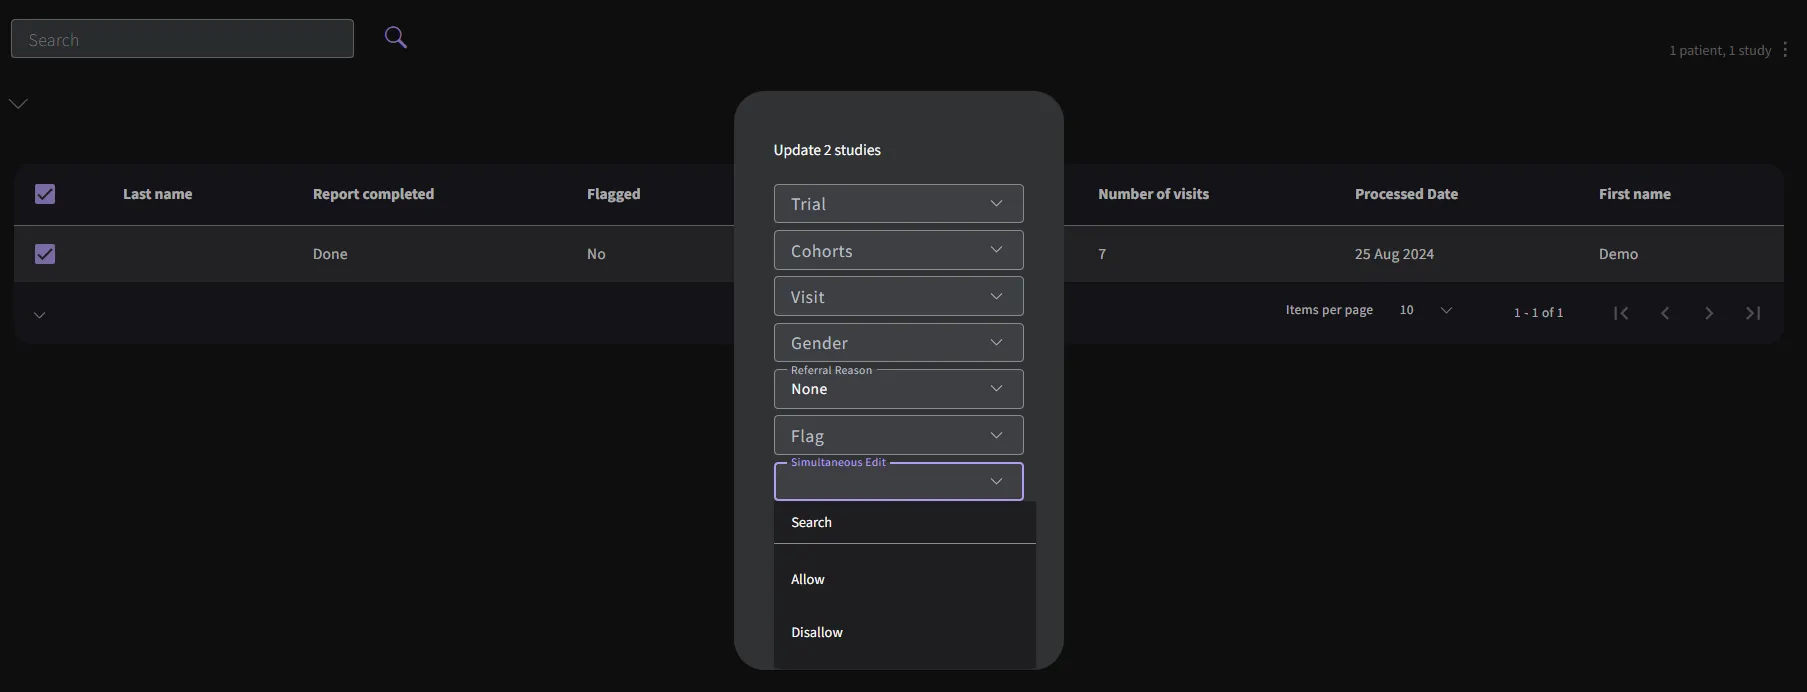
5.1.1 Simultaneous Editing of Reports
The ability to allow or disallow simultaneous editing of a report can be managed at two levels:
- Report Level:
Permissions for simultaneous editing can be configured directly within the specific report settings. This allows for granular control, ensuring that collaborative editing is enabled or restricted as needed for individual reports.
- Search Panel:
The simultaneous editing setting can also be managed from the search panel. This provides a centralized approach to quickly update permissions across multiple reports, streamlining the management process.
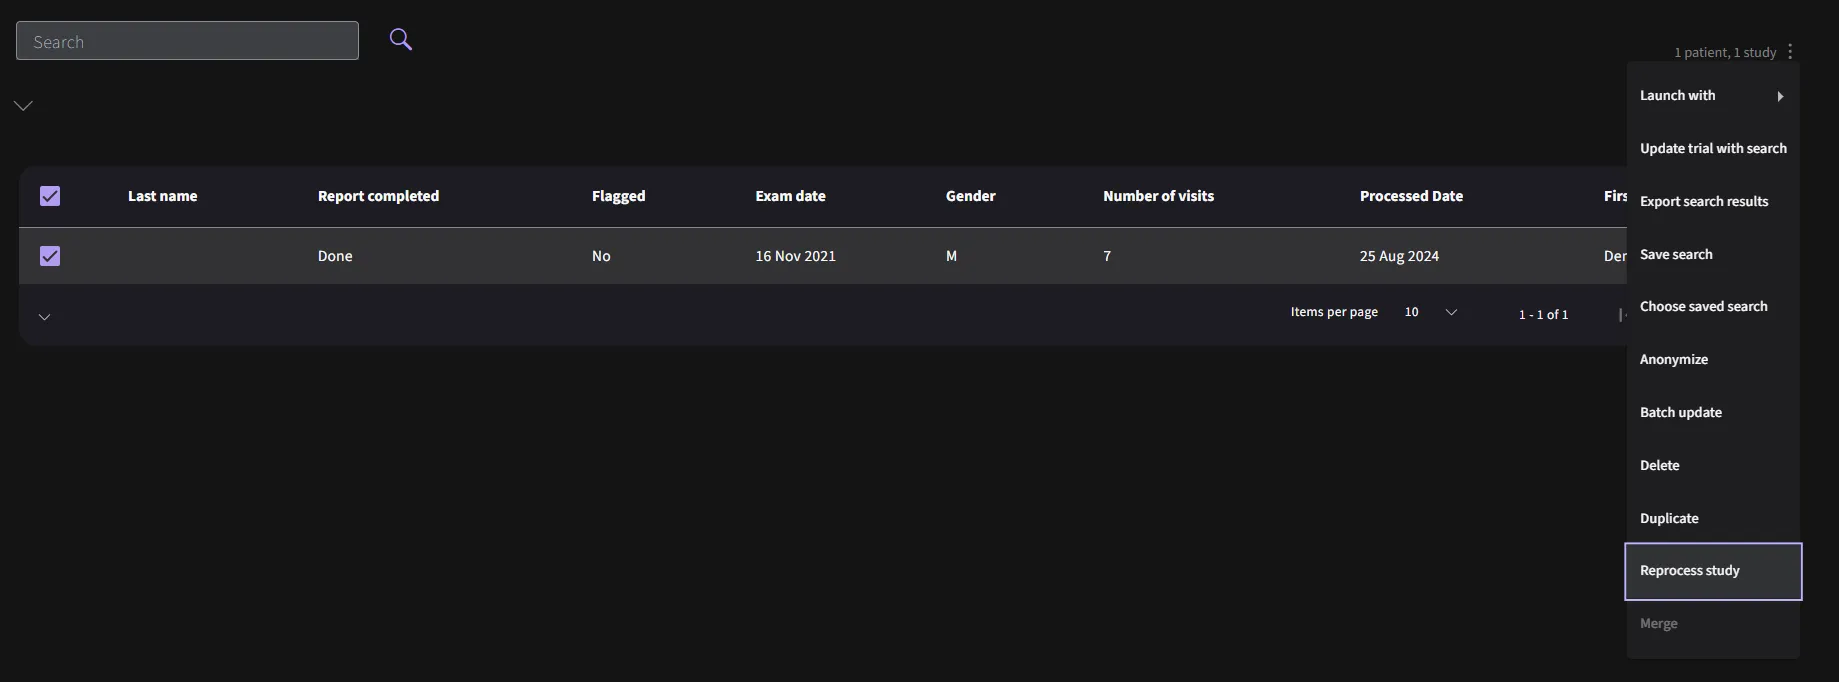
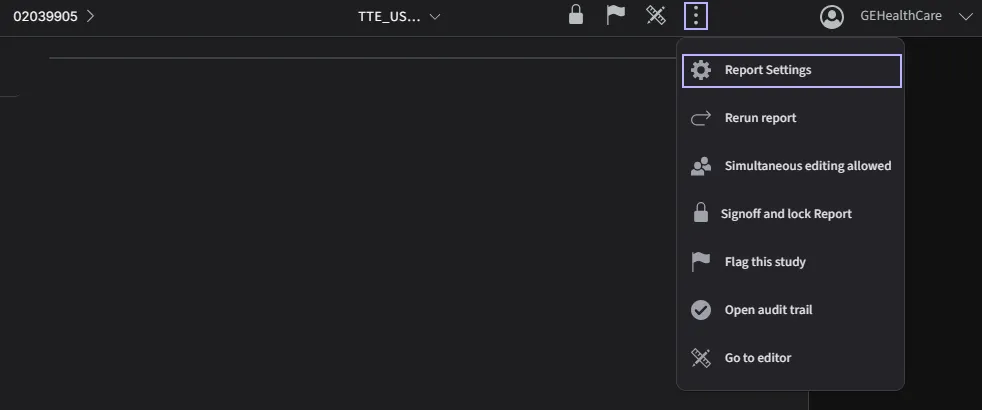
5.1.2 Reprocess a Report
Report can be reprocessed to update to the latest version Click on this option to initiate the reprocessing.
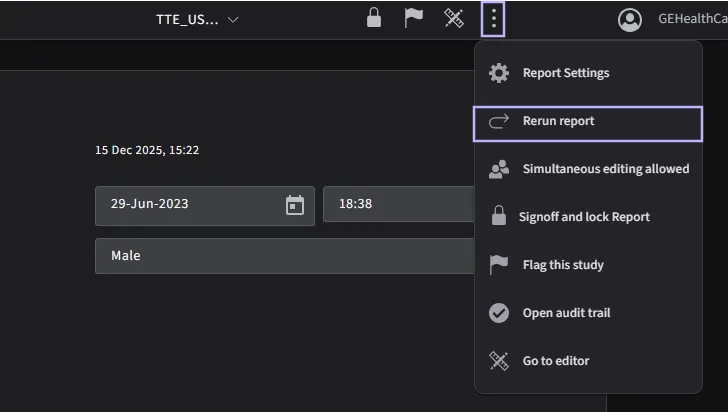
Or from the search panel.
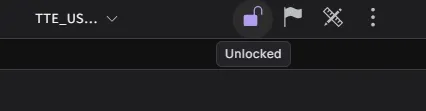
5.1.3 Locking a Report
5.1.3.1 Unapproved State
A Report is in the unapproved state when the lock icon at the top of the report is open. In this state, the main findings and echo parameters have not been approved.
5.1.3.2 Approved State
Reports can be locked by clicking on the lock icon at the top of the Report. An alert will appear to confirm the choice.
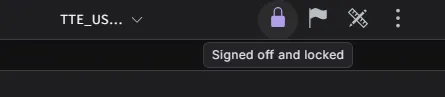
When the report is being approved, both the main findings and echo parameters are marked as approved.
5.1.3.3 Partially Approved State
If additional main findings or echo parameters are being added to an existing approved report, the report transitions to a partially approved state. In this state, the changes made require approval from the user once again.
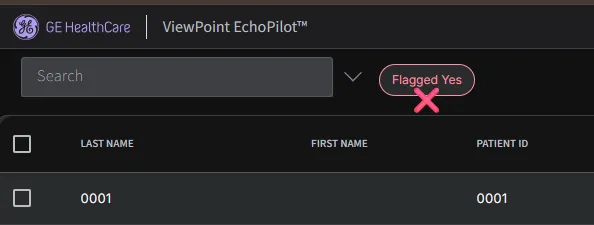
Studies can be flagged for quicker search retrieval by clicking on the flag icon, in the header of either the Report
5.1.4 Flagging a Report
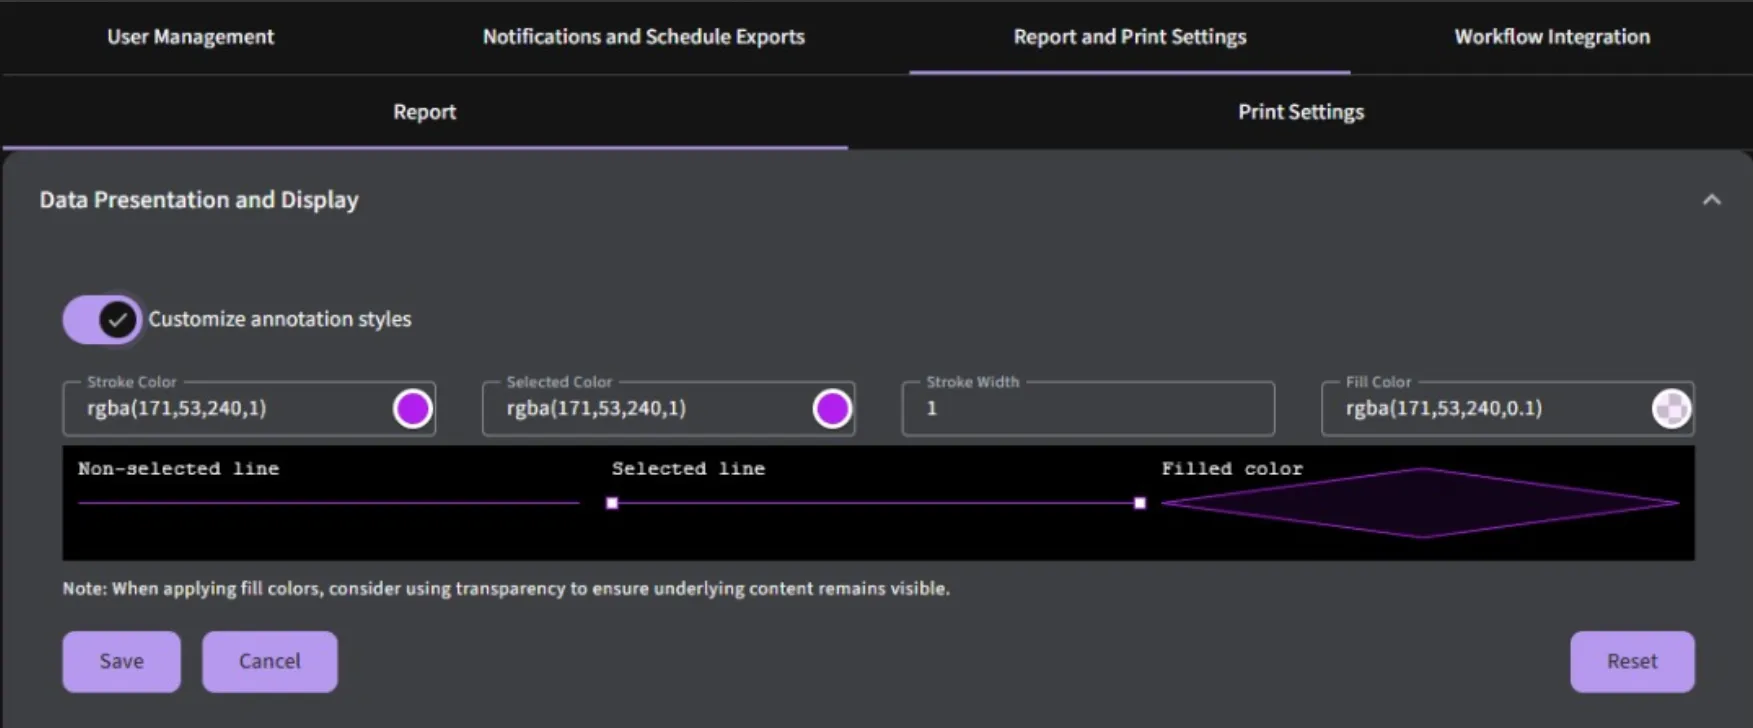
5.1.5 Customize Annotation Styles
There is a flexibility to adjust both the color and opacity of annotations directly from the settings page. This allows you to tailor your annotations to better fit your visual preferences and improve readability.
5.1.6 Report Customization
Reports can be customized by clicking on your user name → then selecting Settings from the pull down menu → then clicking on the Print Settings section.
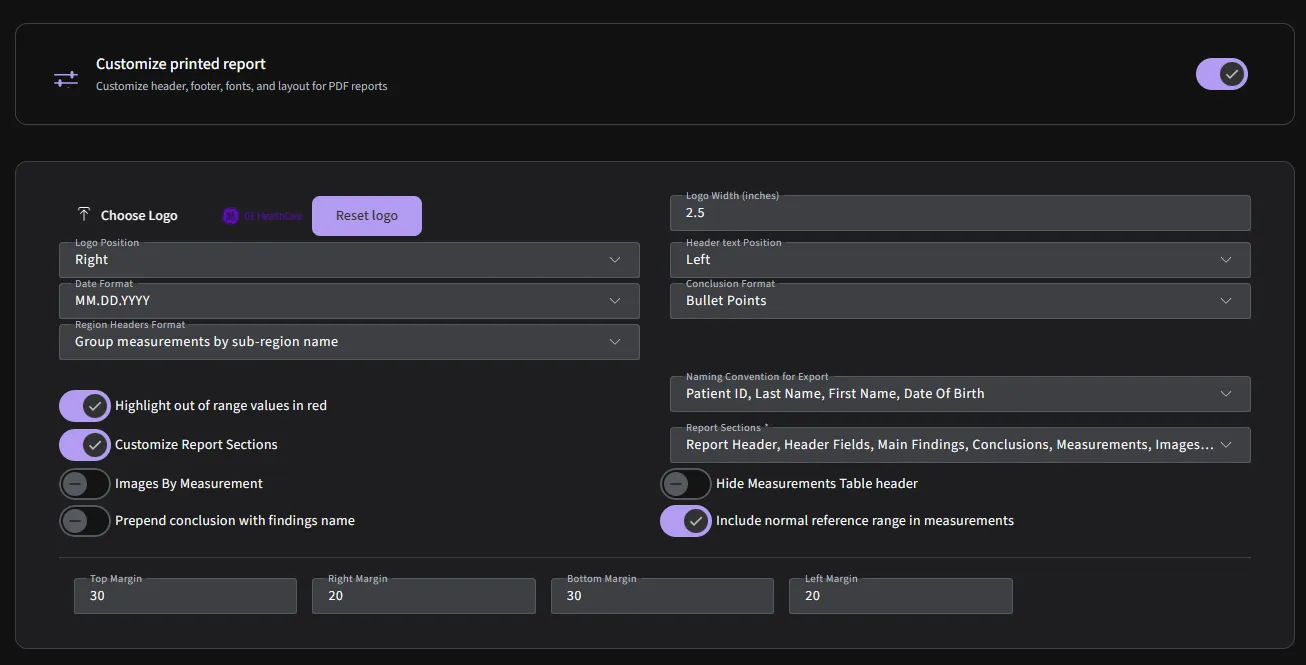
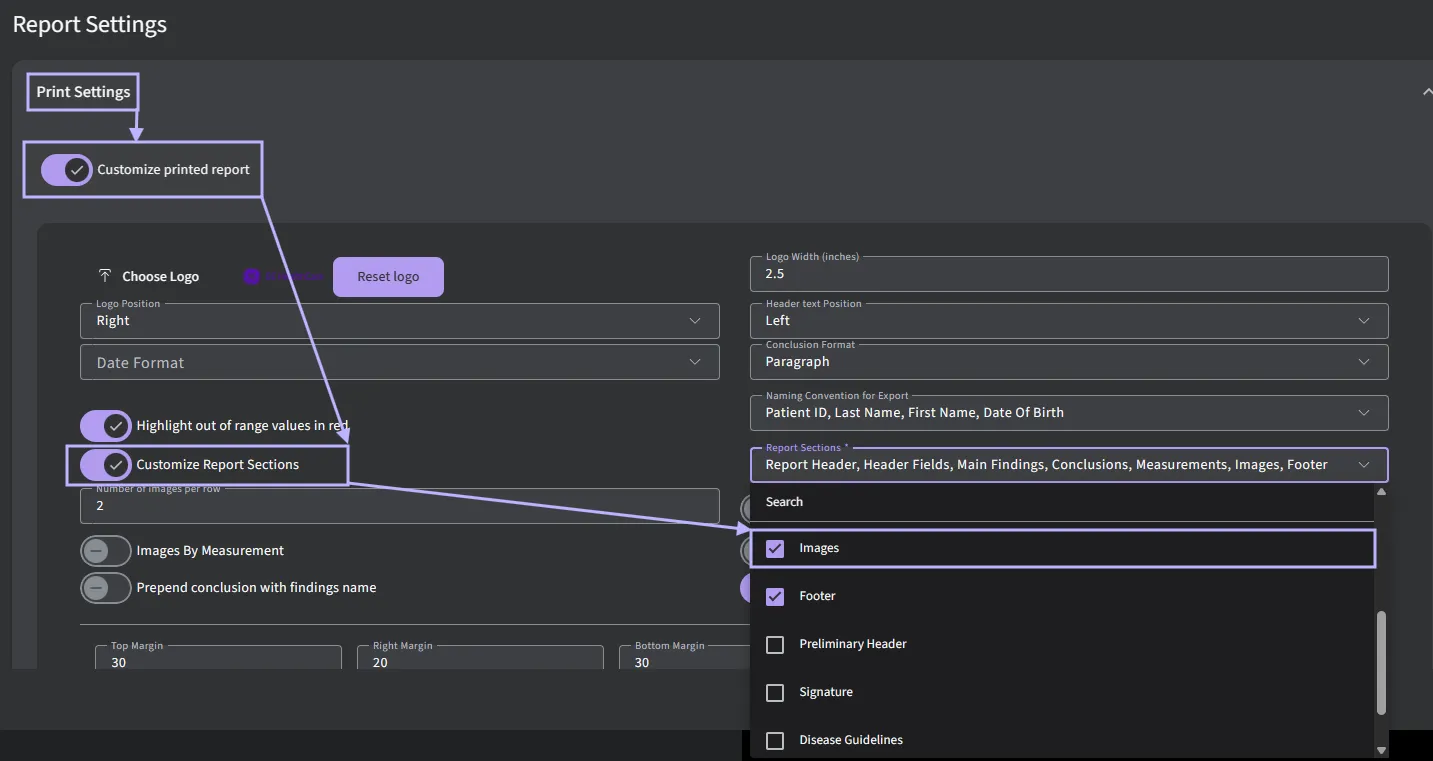
There is a flexibility to determine the amount of information displayed in the PDF report. To customize the report, go to "Customise Printed Report" and select the sections you would like to include from the dropdown menu. The following options are available for selection:
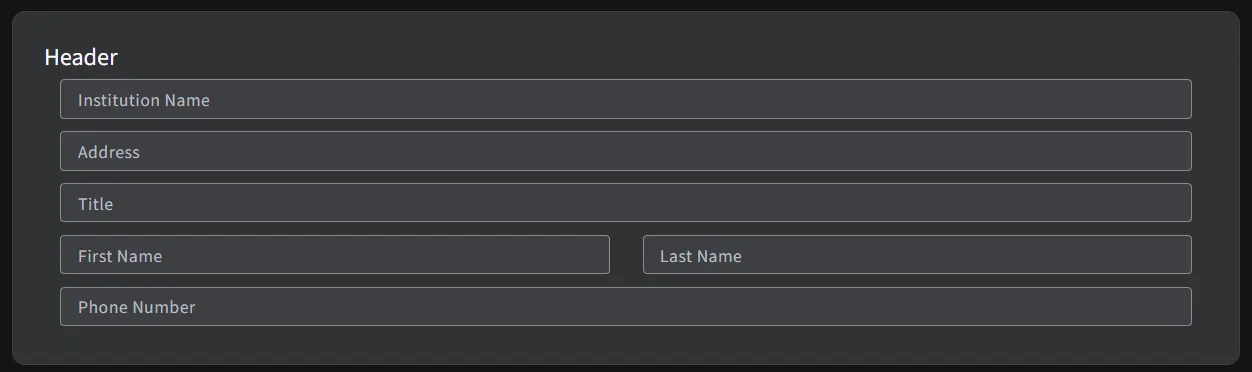
- Report Header
- Header Fields
- Conclusions
- Signature
- Main Findings
- Notes
- Footer
- Disease Guidelines
- Measurements
- Images
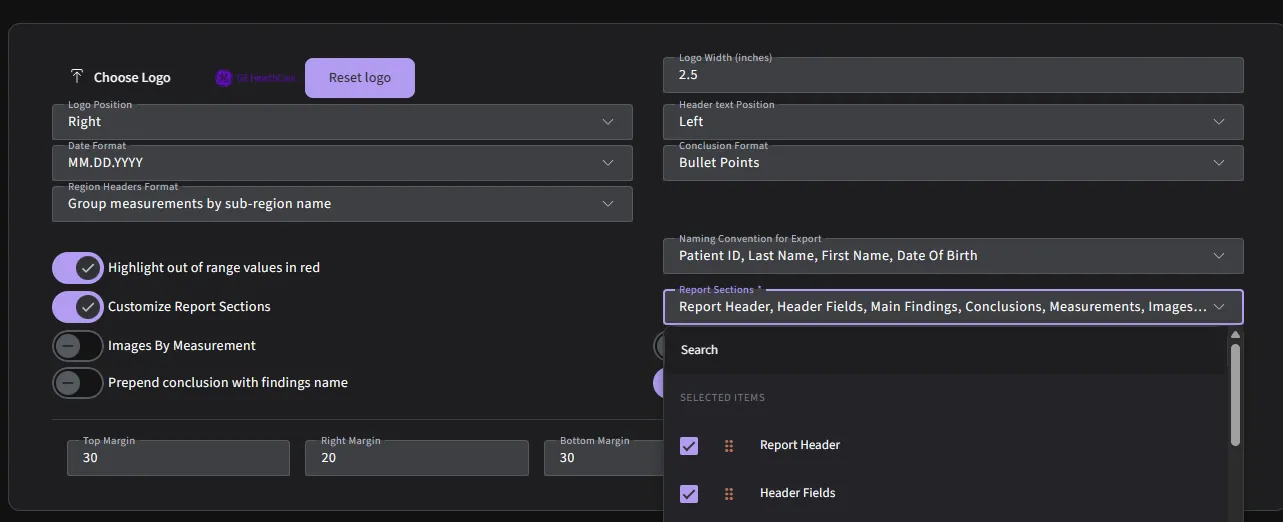
You can adjust your preferred page margins and adjust formatting to match your reporting style.

To remove the logo from the report, click on “Reset logo” button.

5.1.6.1 Signature
5.1.6.1.1 Creating and Managing Signature Templates and Authentication
You can now apply digital signatures with customizable templates, PIN-based authentication, and protocol-specific defaults. In addition, you can now add multiple reading consultants to a report using a convenient dropdown selection.
- Access the Signature Section: Navigate to the Signature section in the application.
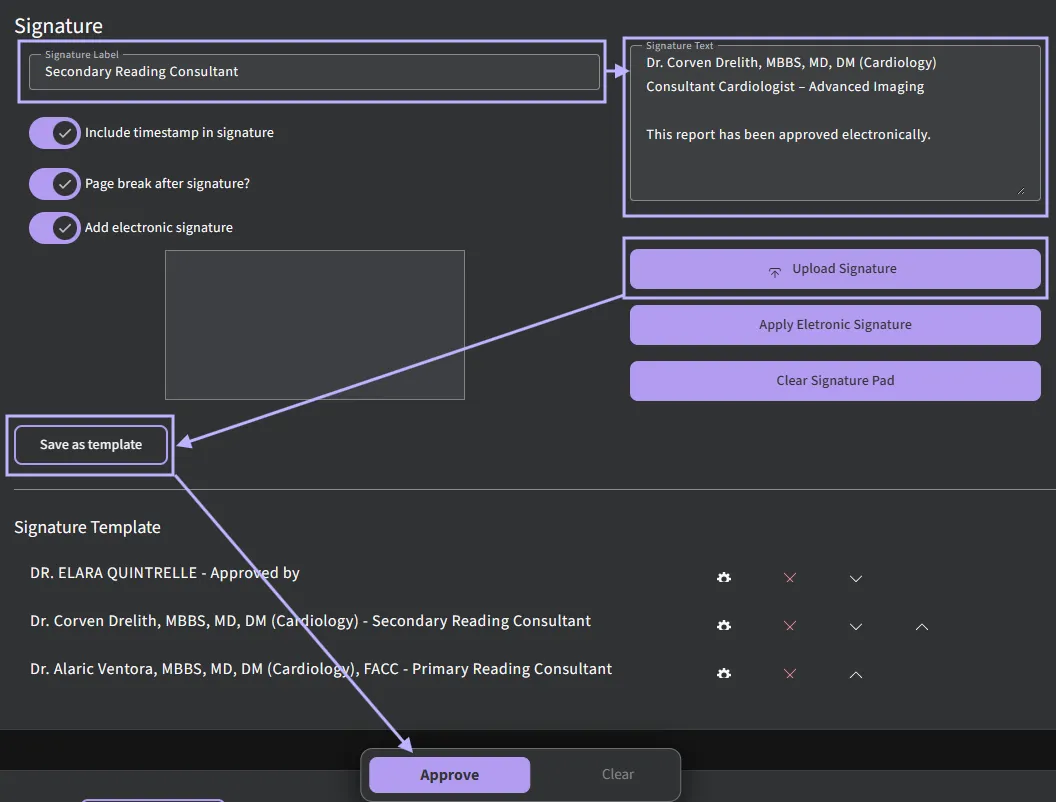
- Enter Signature Details:
- In the Signature Label, indicate the role (e.g., Reading Consultant, Sonographer).
- In the Signature Text, enter the doctor’s name, position, and credentials.
- Upload Signature Image: Click Upload Signature to upload the doctor’s signature file.
- Save as Template:
- Click Save as Template.
- A pop-up will appear asking for a Signature Template ID.
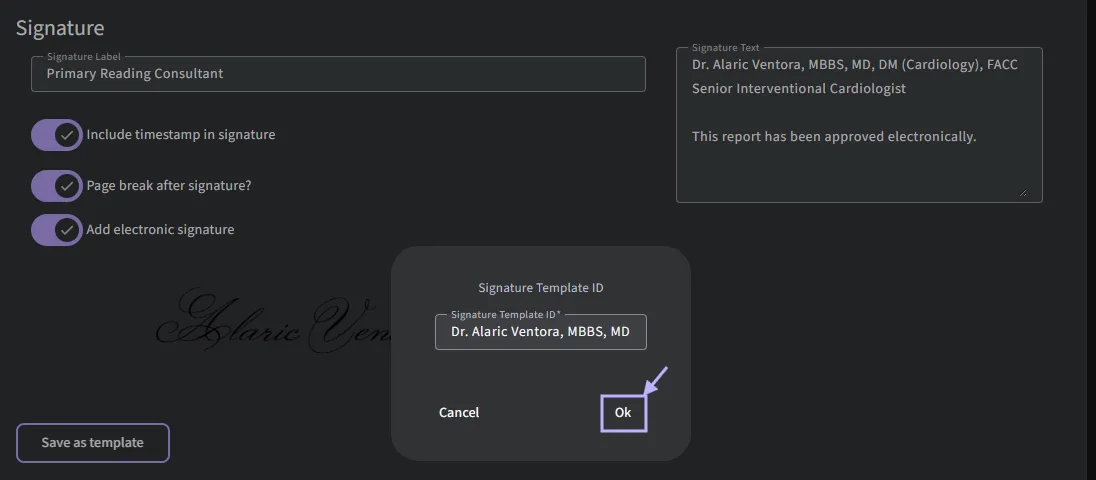
- Select OK to confirm.
- Example Preview: Once saved, the signature will appear in the report as shown in the preview.
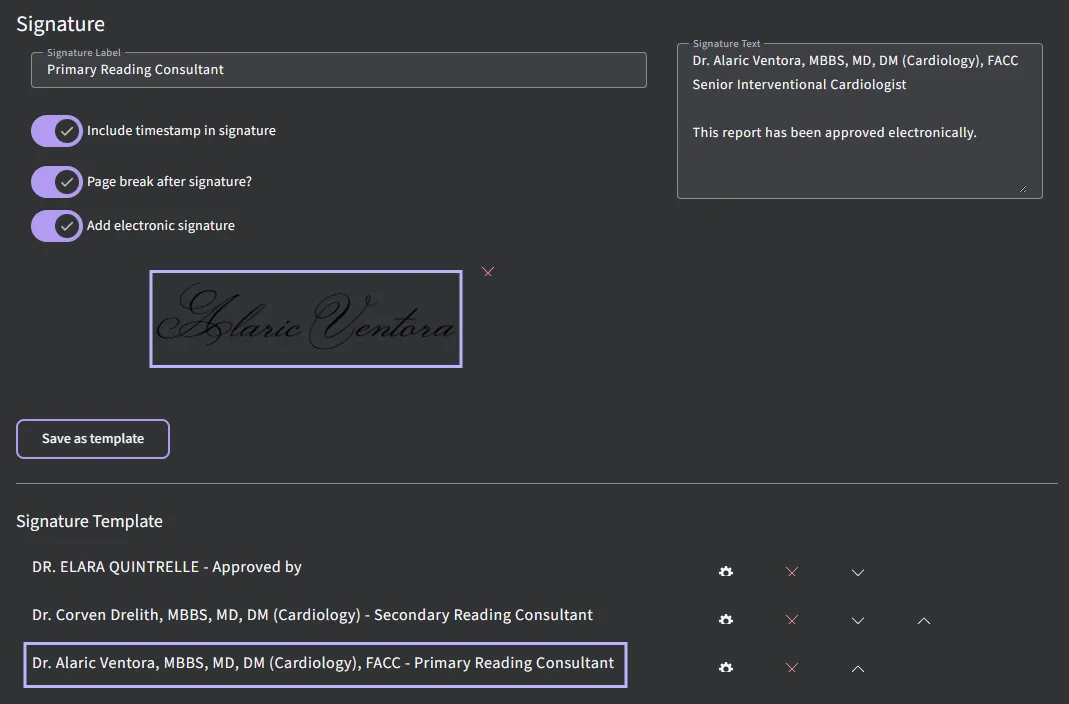
- Adding Multiple Doctors:
- Repeat the above steps to create templates for multiple doctors.
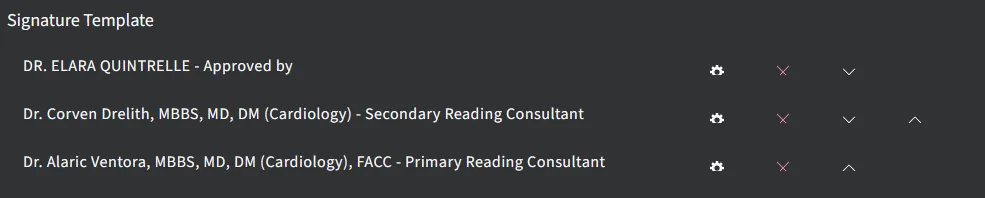
- These templates can then be selected from the dropdown list when signing off a report.
- Repeat the above steps to create templates for multiple doctors.
- Associating Signatures with Protocols:
- You can tie a signature to a specific protocol.
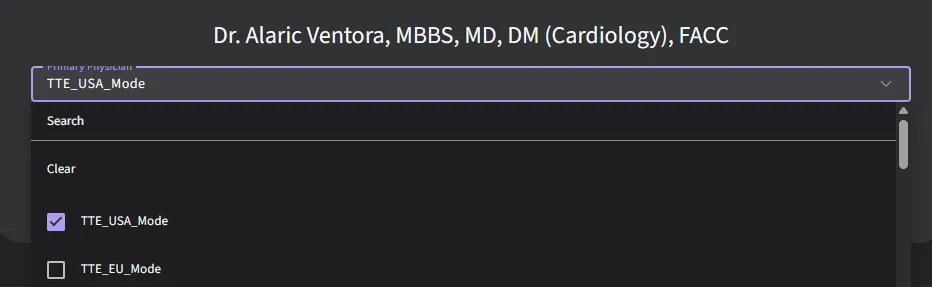
- When that protocol is activated, the system will automatically load the corresponding doctor’s signature for the report.
- You can tie a signature to a specific protocol.
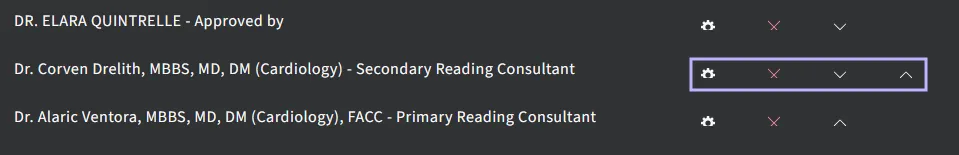
- Additional Signature Controls:
- Set Default Signature Based on Protocol: Automatically apply a pre-defined signature for a given protocol.
- Remove Signature Template: Delete an existing template if no longer needed.
- Move Up / Move Down: Adjust the order of signature templates in the dropdown list.
5.1.6.1.2 Activating PIN Authentication (Optional)
You can enable PIN-based authentication to securely apply digital signatures.
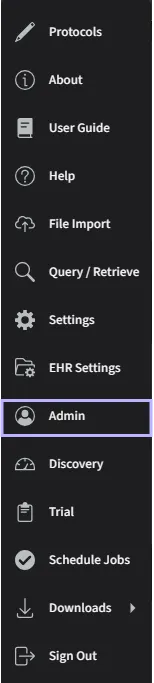
- Access Admin Settings:
- Click on your username and select Admin.
- Configure User PIN:
- Click on the username and go to Print Settings.
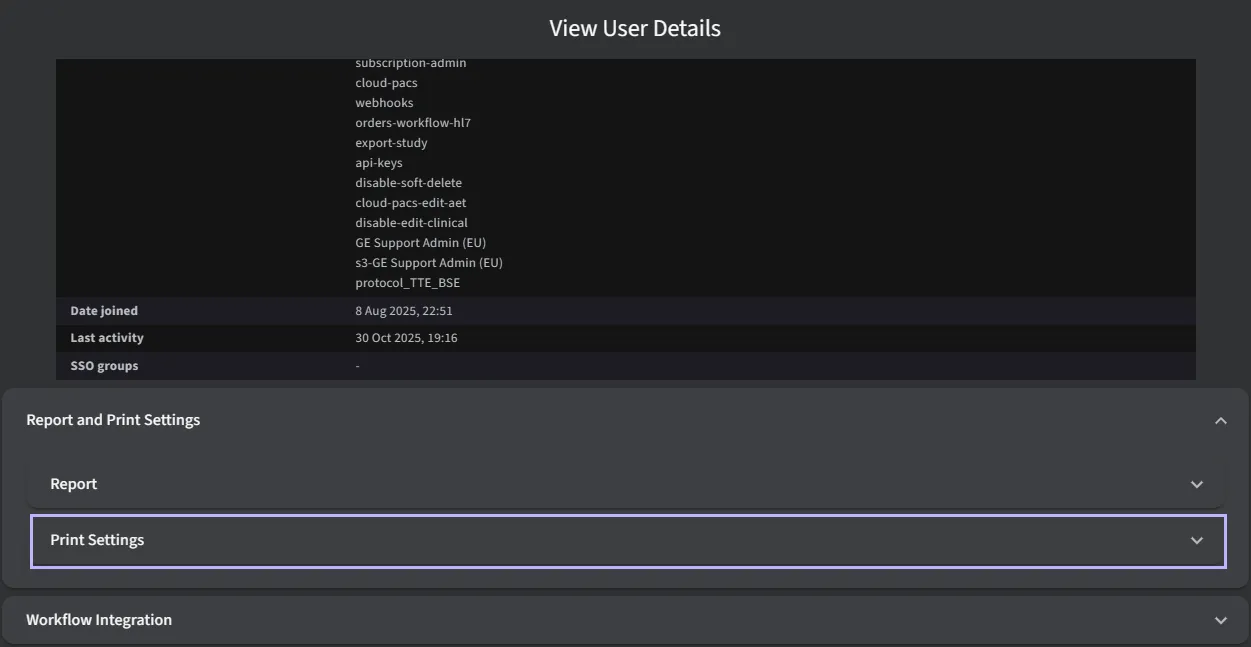
- Locate the Sign-off PIN field (4-digit PIN) and enter the desired PIN.
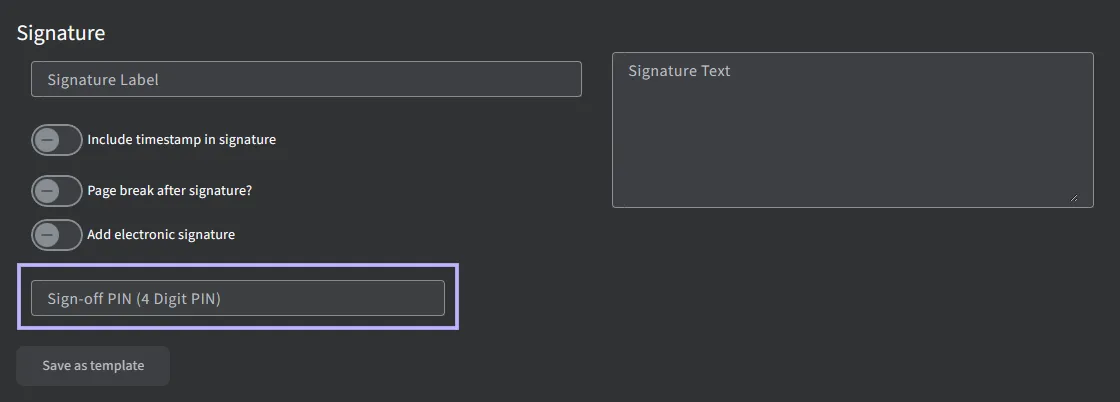
- Click on the username and go to Print Settings.
- Save Settings:
- Ensure you save your changes to enable PIN authentication for signing reports.
5.1.6.1.3 Applying Digital Signatures to a Report
Once all signature templates and PIN authentication are set up, you can apply signatures when preparing a report:
- Open the Report: Navigate to the report you want to sign.
- Select the Locked Icon: Click the lock icon next to the study.
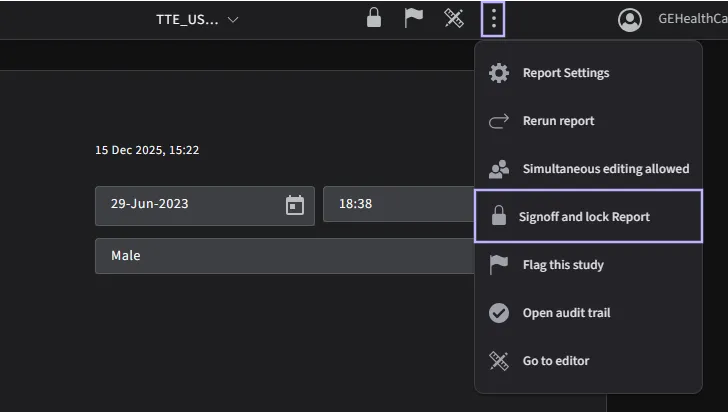
- Load Signature Templates: The previously created report signature templates will appear automatically.
- Select Doctor: Choose the appropriate doctor from the list to sign off the report.
- Apply Signature: The selected doctor’s signature will be applied according to the template and protocol settings.
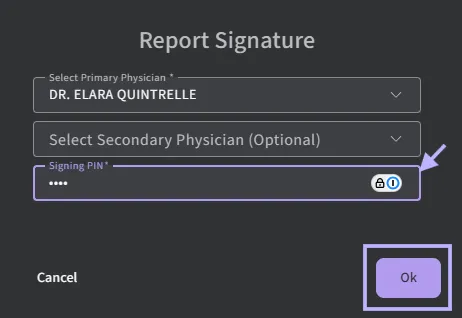
- If PIN authentication is enabled, you will be prompted to enter the signing PIN first, then click OK to confirm.
5.1.6.1.4 Footer
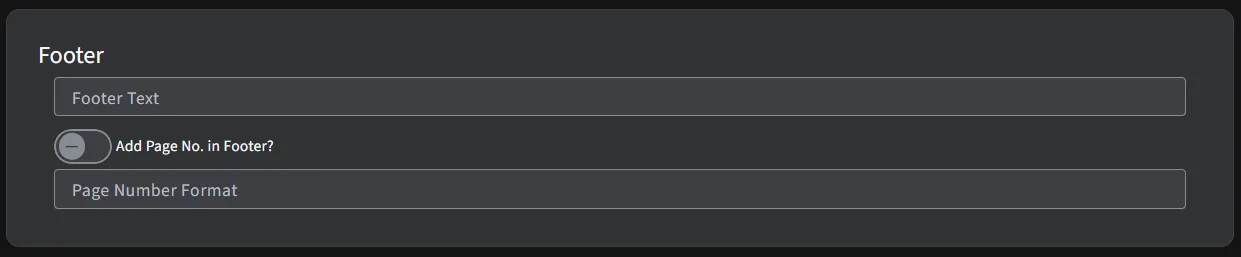
- Footer Text: Customizable text to appear in the footer (e.g.,
{LAST_NAME}, {FIRST_NAME}). - Add Page No. in Footer: Toggle ON/OFF to include page numbers.
- Page Number Format: Customize the format, e.g.,
{page_no} of {total_pages}to display "Page 1 of n".
5.1.6.1.5 Font
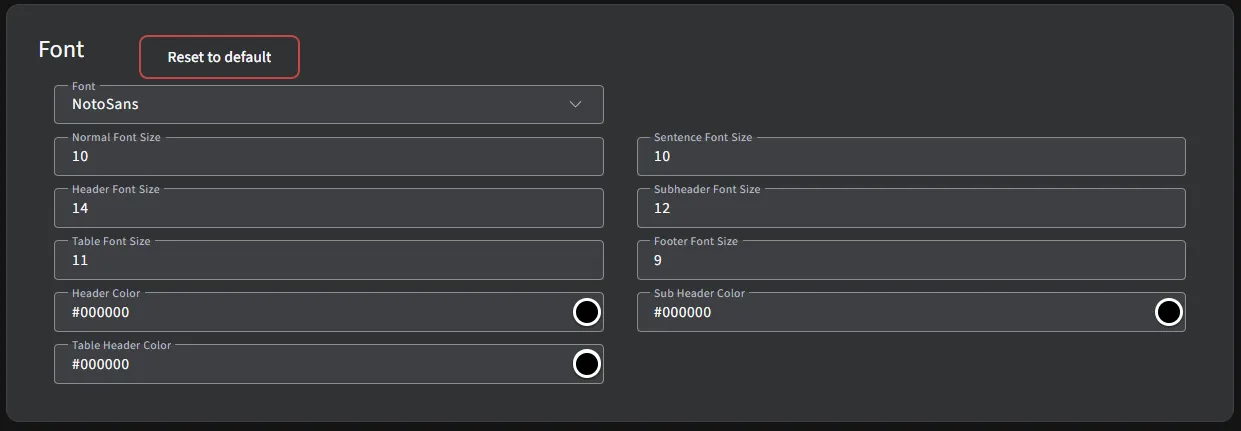
- Font Customization: Adjust font sizes for specific sections:
- Normal Font Size: Default text size (e.g., 10).
- Header Font Size: Size for headers (e.g., 14).
- Sentence Font Size: Customize font for sentences (e.g., 10).
- Subheader Font Size: Set the size for subheaders (e.g., 12).
- Table Font Size: Adjust font size for tables (e.g., 11).
- Footer Font Size: Adjust font size for the footer text (e.g., 9).
- Header Color: Define the color for the main header text.
- Table Header Color: Choose the color for table header rows.
- Sub Header Color: Set the color for subheader text elements.
- Reset to Default: Click to reset all font settings to their default values.
5.1.7 Printing a report
Click the printer icon in the header of the Report in order to print it.

After clicking the printer icon, a print dialog box should appear on your screen. The ‘Print report view’ is to review the structure PDF format report before printing it. The report can be printed by selecting ‘Print’ icon on the top right corner. The report can be downloaded to your computer by selecting the ‘Download’ report button on the top right corner.
For batch PDF export of your search results, navigate to our “Search” page. At the top right corner of the page and locate the three dots icon.
Click on the three dots icon to reveal a dropdown menu. In the dropdown menu, please search for the option labeled “Export Search Result”.
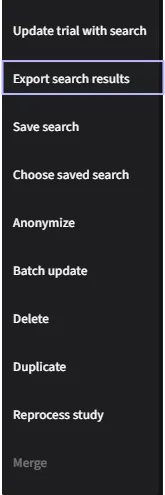
Once found, toggle on PDF report and select your options to initiate the export process for the selected studies.
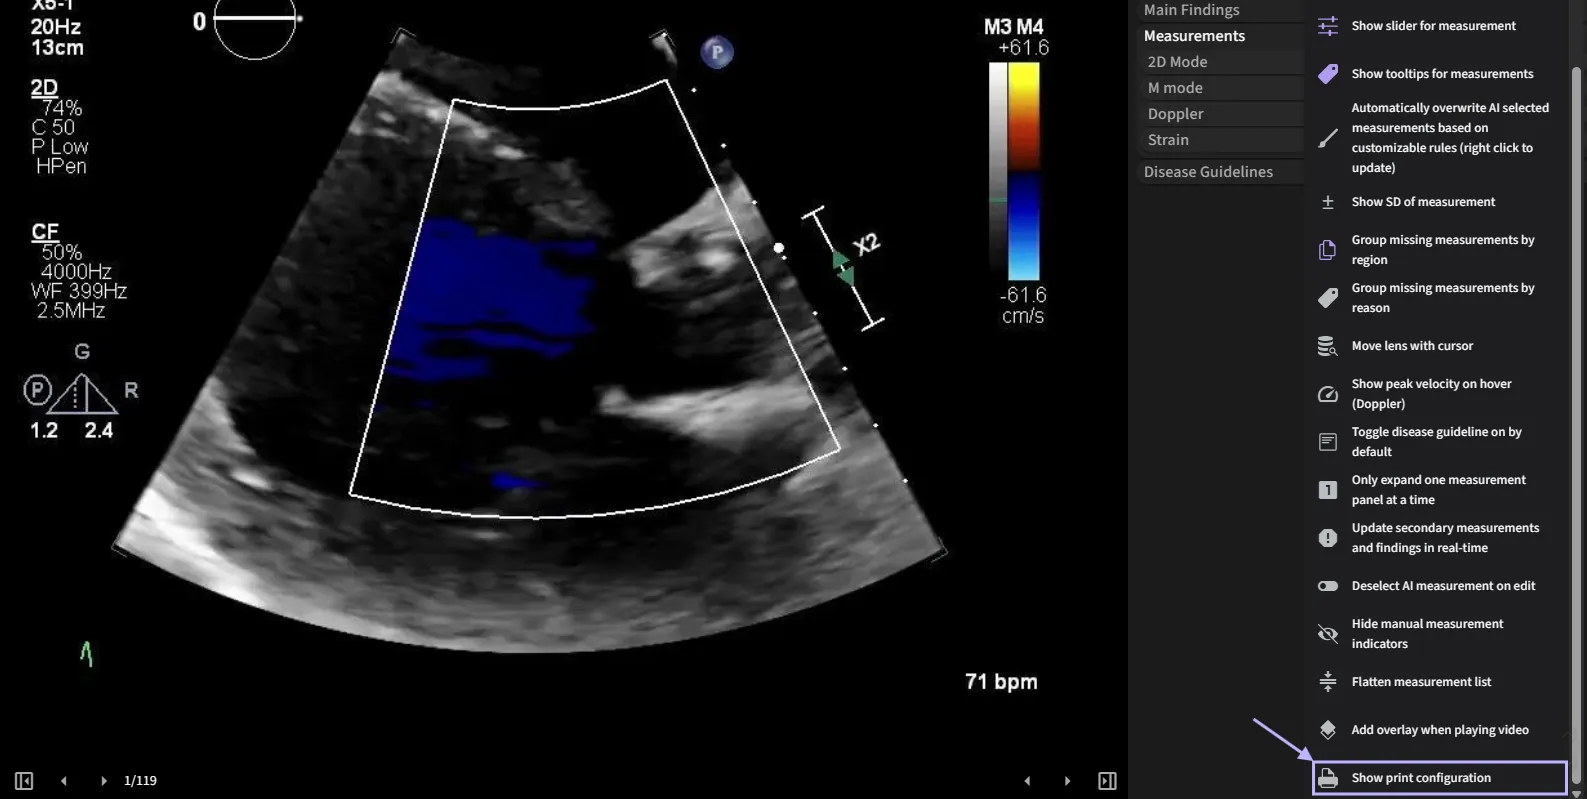
5.1.7.1 Selective Image Printing
The selective image printing feature allows you to filter, preview, and include only the most relevant images in your reports.
- Print-Specific Controls: Adjust image formatting for optimal report presentation.
You may include only the relevant AI-annotated images in your PDF report by adjusting your settings. First, deactivate the default setting that includes all images. Ensure the Image option is selected under the Report section. You will then be able to define the number of images per row by indicating your preference in the provided field.
- Image Filtering – Choose to include only relevant images for the final report.
- Once the Print Control has been activated, the printer icon will appear to the left of each study image.
- Click the printer icon next to the image you want to include in the report. The selected image will be highlighted in red to indicate it has been chosen. After selecting all desired images, click the Save button to confirm your selections.
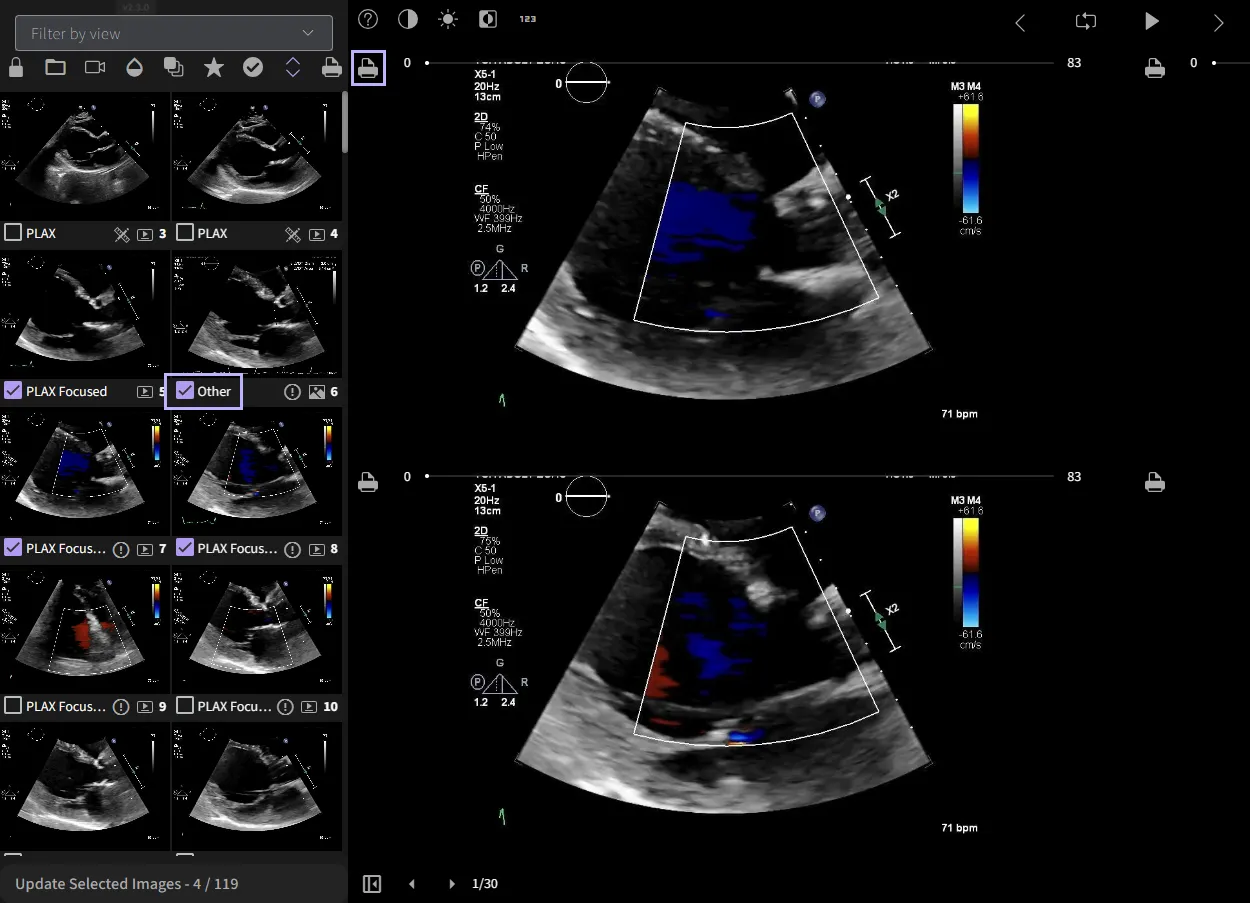
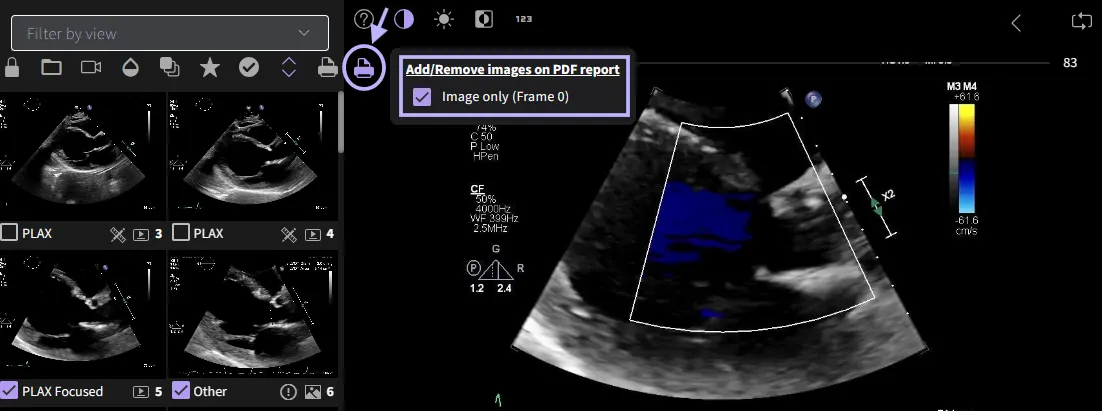
- You can preview the selected images in the thumbnail view below to ensure accuracy before printing.
- Once the Print Control has been activated, the printer icon will appear to the left of each study image.
5.2 Audit Trail
You may review user actions within your account using the Audit Trail function. Clicking a row in this table will lead you to the particular report. You will be able to filter the entries through a calendar dropdown and limit the query based on the selections.

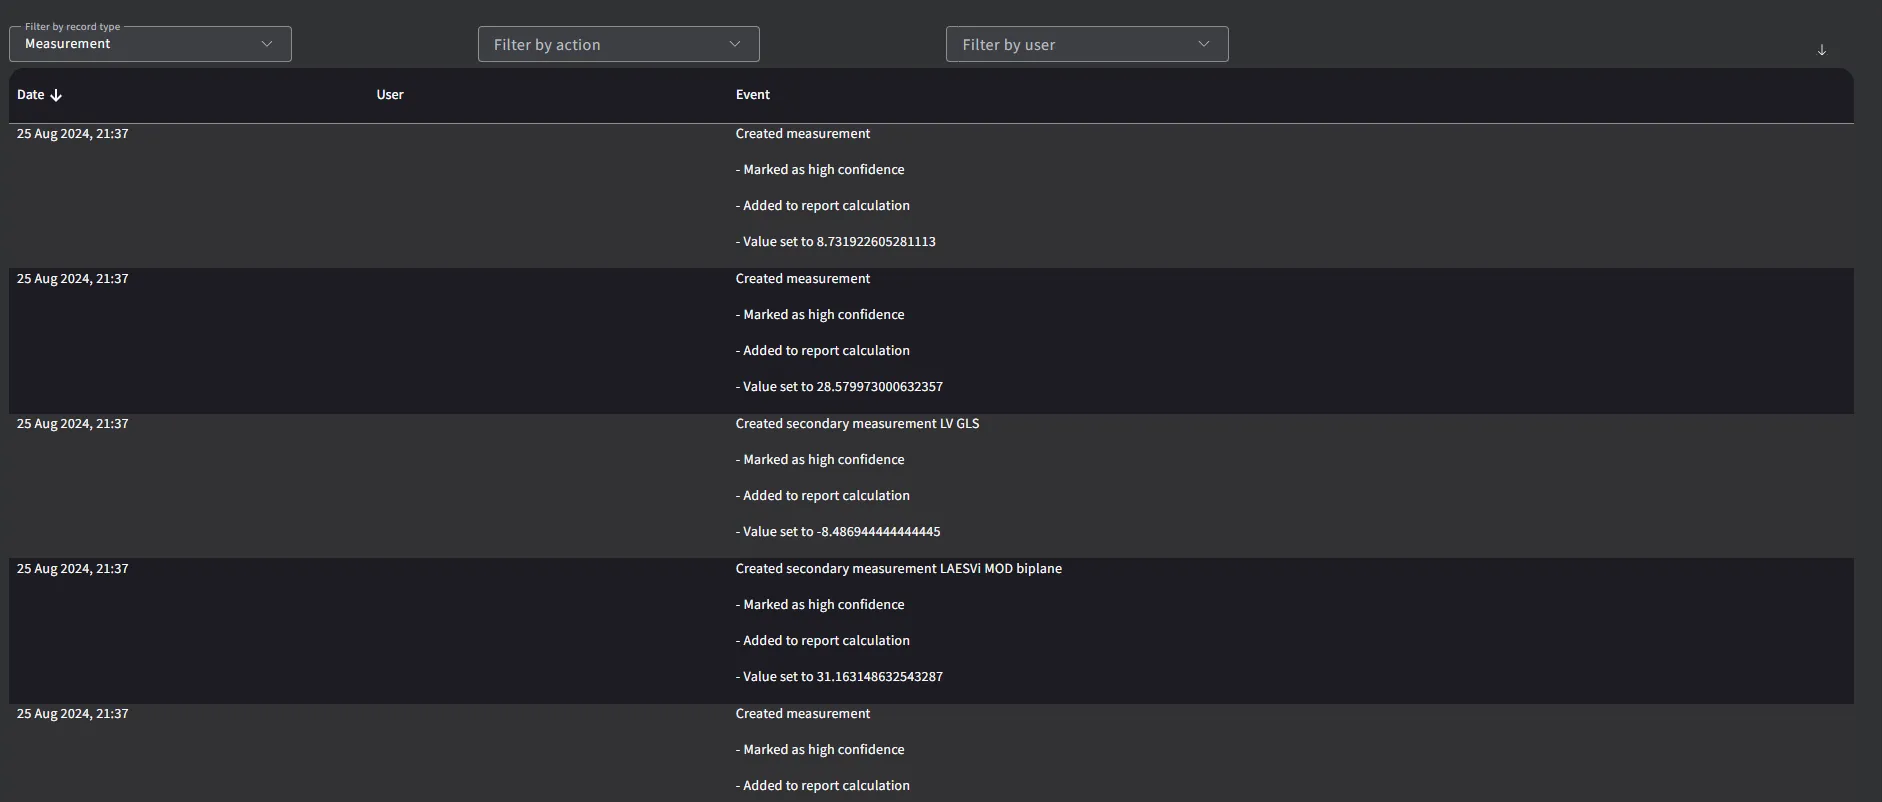
Clicking on any row of the audit trail, the Measurement Service will query with the respective measurement IDs and retrieve the route the direct you to the report. Then clicking the Ok button.
5.3 Correlate Clinically
The notes field in the Report can be used to correlate clinically and make additional observations. As soon as an edit to the Notes field is made, the Save button will appear in order to save changes.
5.4 Editing patient information
Patient information such as name, gender and other characteristics at the top of the Report can be edited.
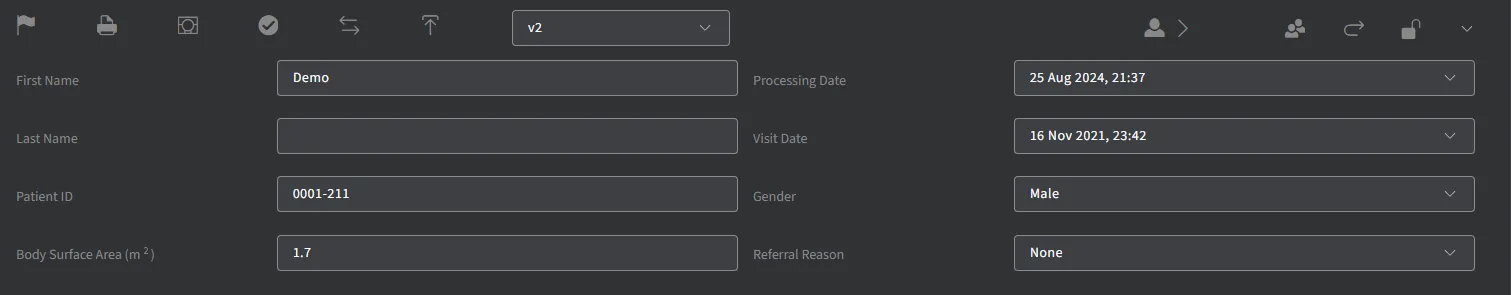
If there are more patient demographic details that need to be included in the report, expand the toggle to reveal the dropdown menu where you can add any other relevant details.
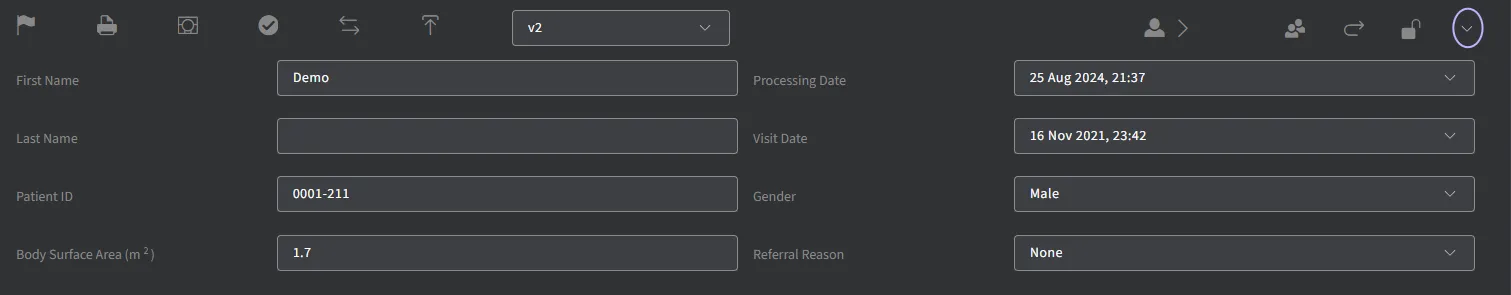
Once you are satisfied with the edits and additions, locate the “Save” button within the application. The “Save” button is usually found at the bottom of the screen. Click on the “Save” button to save all changes you have made to patient’s information and demographics.
If the gender of the patient has not been set, this will be indicated in the Notes field and female guideline values used to determine out of range values. Once the gender is set, this indication in the Notes field will be removed.
5.5 Navigating through studies
When searching for studies, depending upon the search criteria used, you may have many search results. All the search criteria will appear at the top of the search page.

By hovering over the search criteria, you can remove it from the filter list.
You can navigate one by one through all these studies by either clicking on the search result, or by clicking the next/previous study arrow in the header of the Report.

5.5.1 2D videos
Annotations can be edited by clicking or dragging the mouse over any of the circles that from part of the annotation.
Adjust the smoothing and simplify annotations level by simply press the “S” key on your keyboard to make your annotation look cleaner and more polished.
Multiple points for editing can be performed by using the Shift key and left-clicking the mouse. When holding the Shift key, left click to move across the points you want to include in your selection. The point should now be highlighted in red to indicate that it’s selected. Now that you have successfully selected multiple points, you can proceed with your desired editing task.
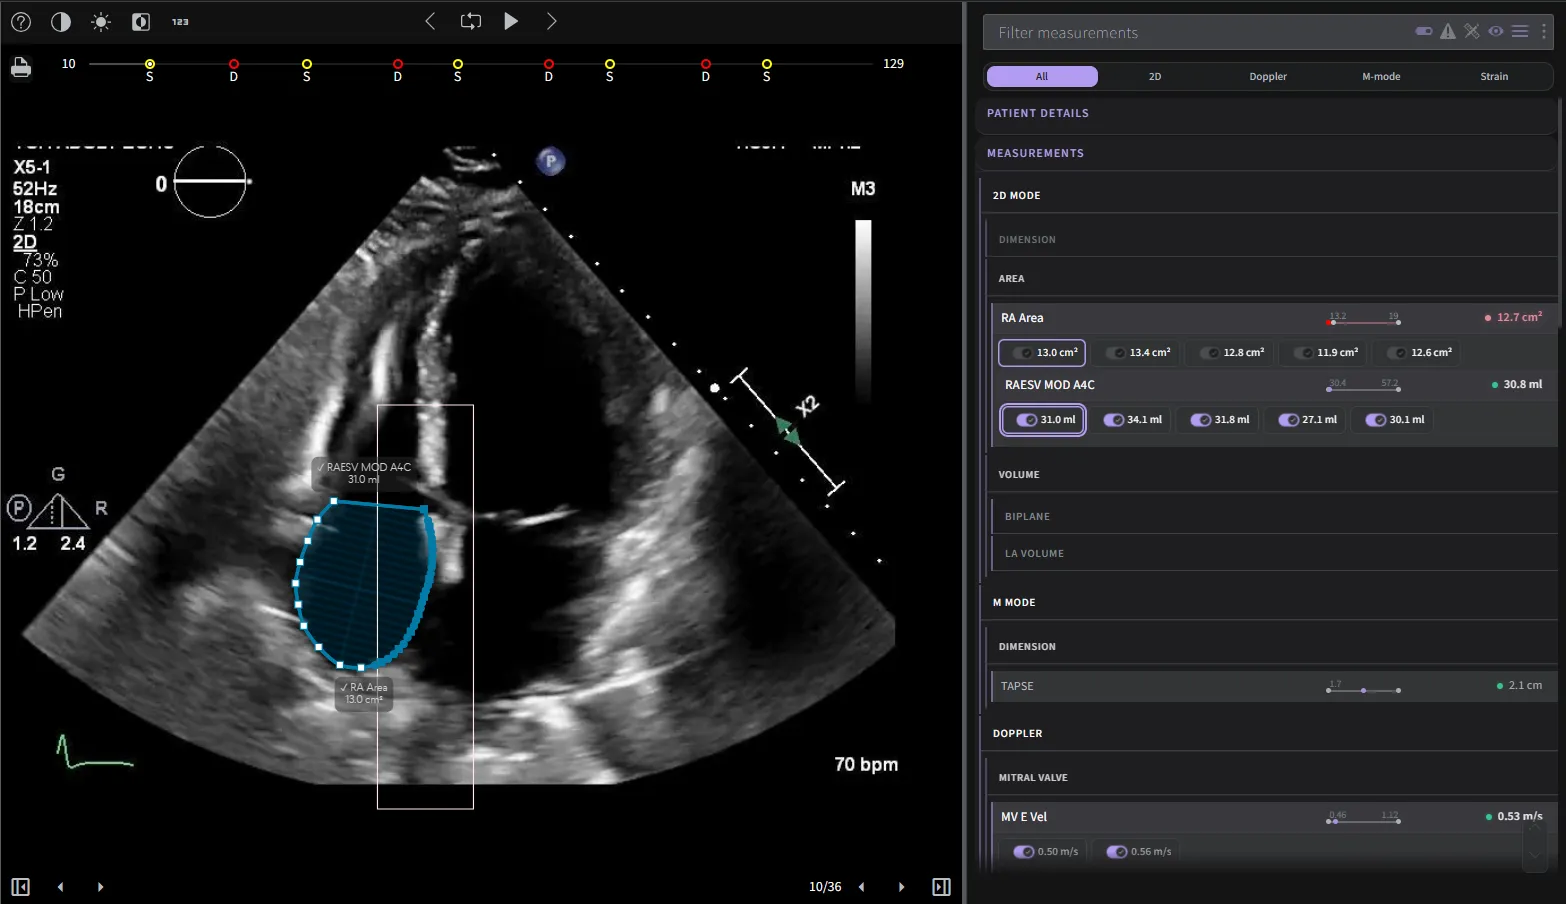
If you need to deselect the points, simply click anywhere outside the selected area and the selection will be cleared.
New annotations can be created by pressing the + icon in the Measurement Panel.
Select the annotation you want to delete, look for the icon next to it and click on it.
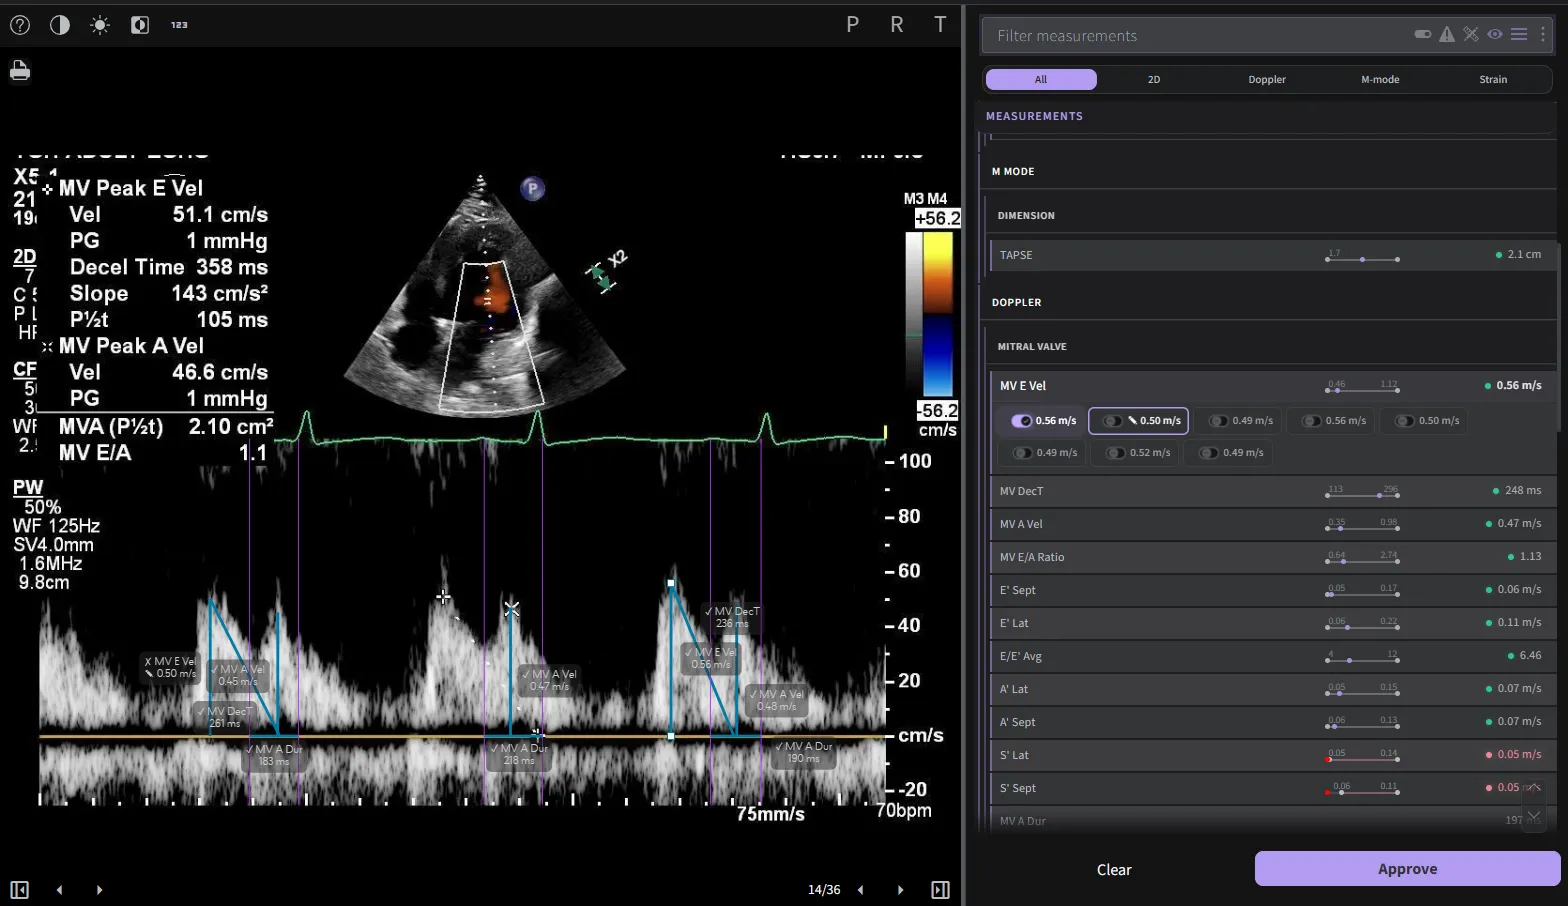
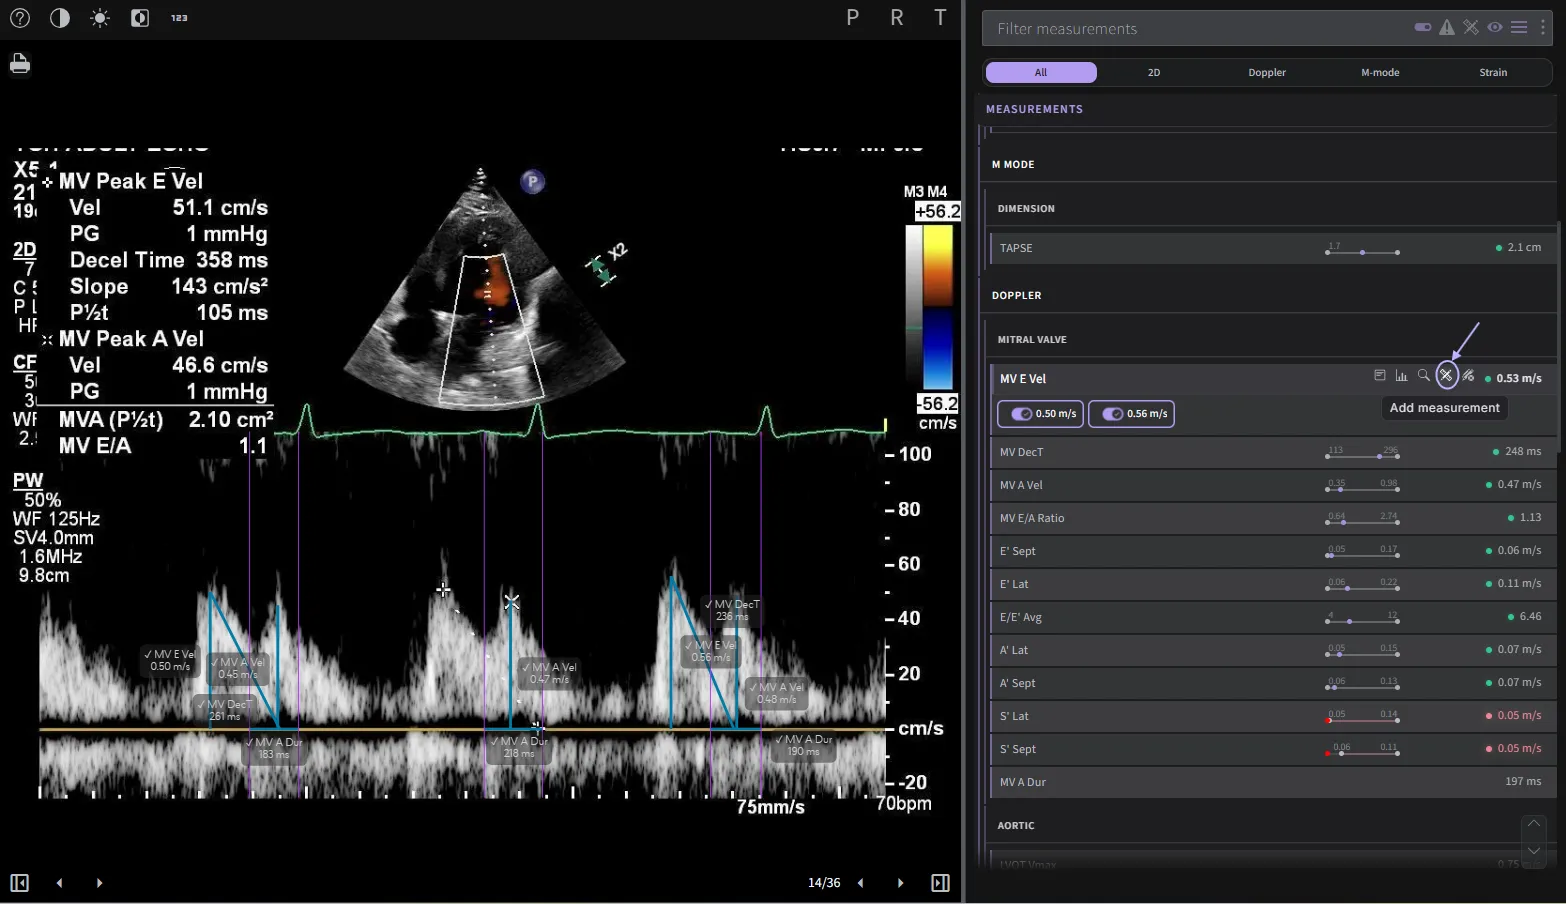
5.5.2 Doppler images
Clicking on the toggle icon allows you to see any other annotations, if any, that were made on the currently displayed image.
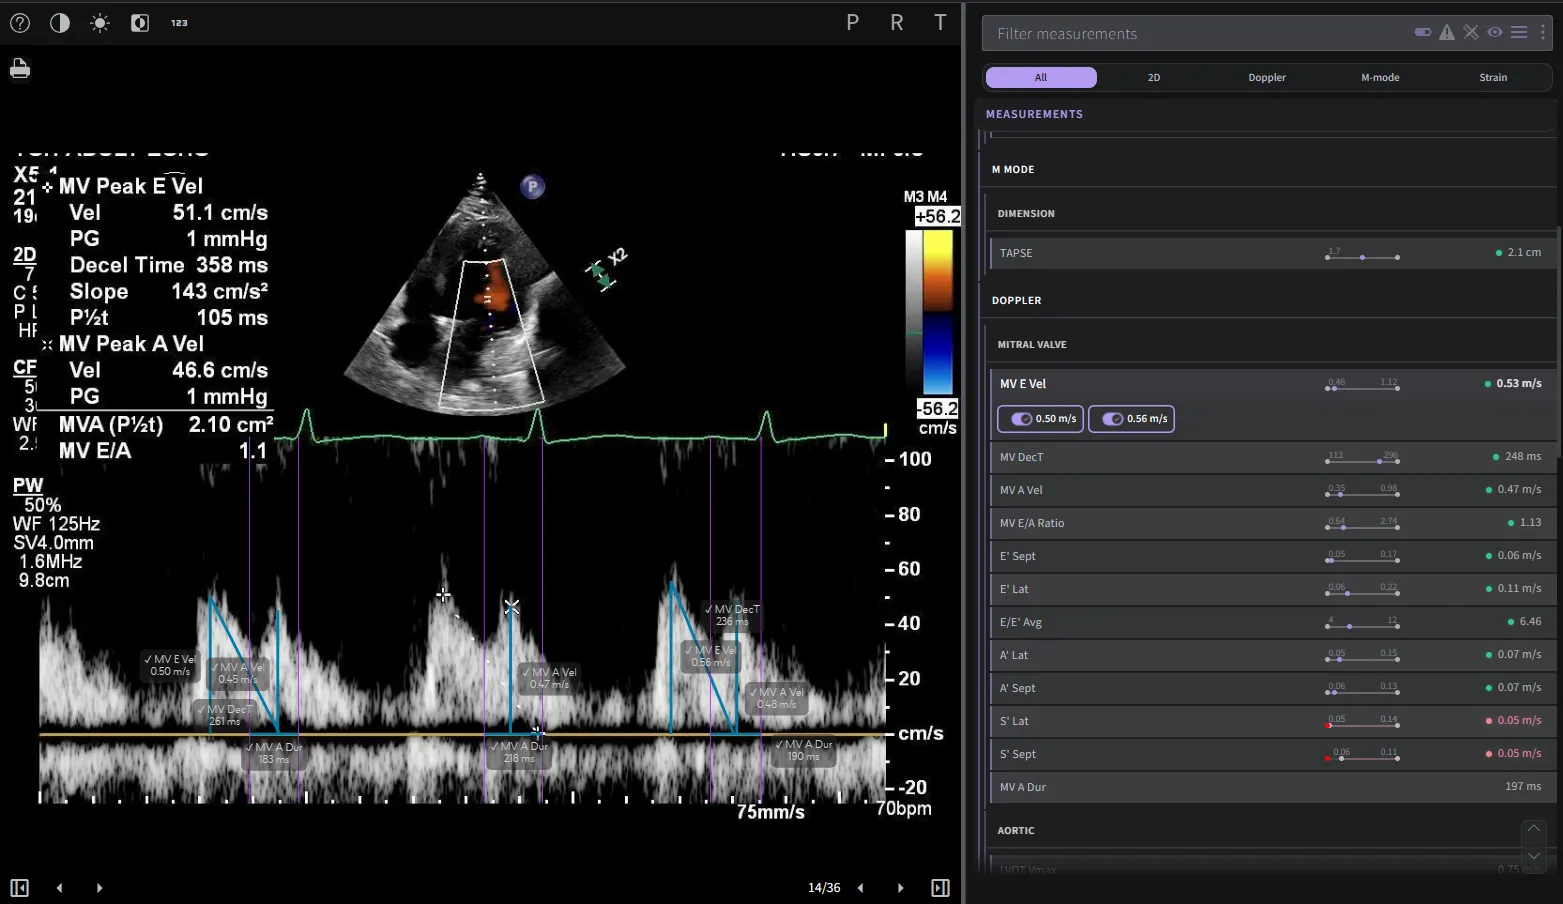
New annotations can be created by pressing the + icon in the Measurement Panel. Both new and edited measurements must be saved by clicking the Save buttons


5.5.3 Editable Strain
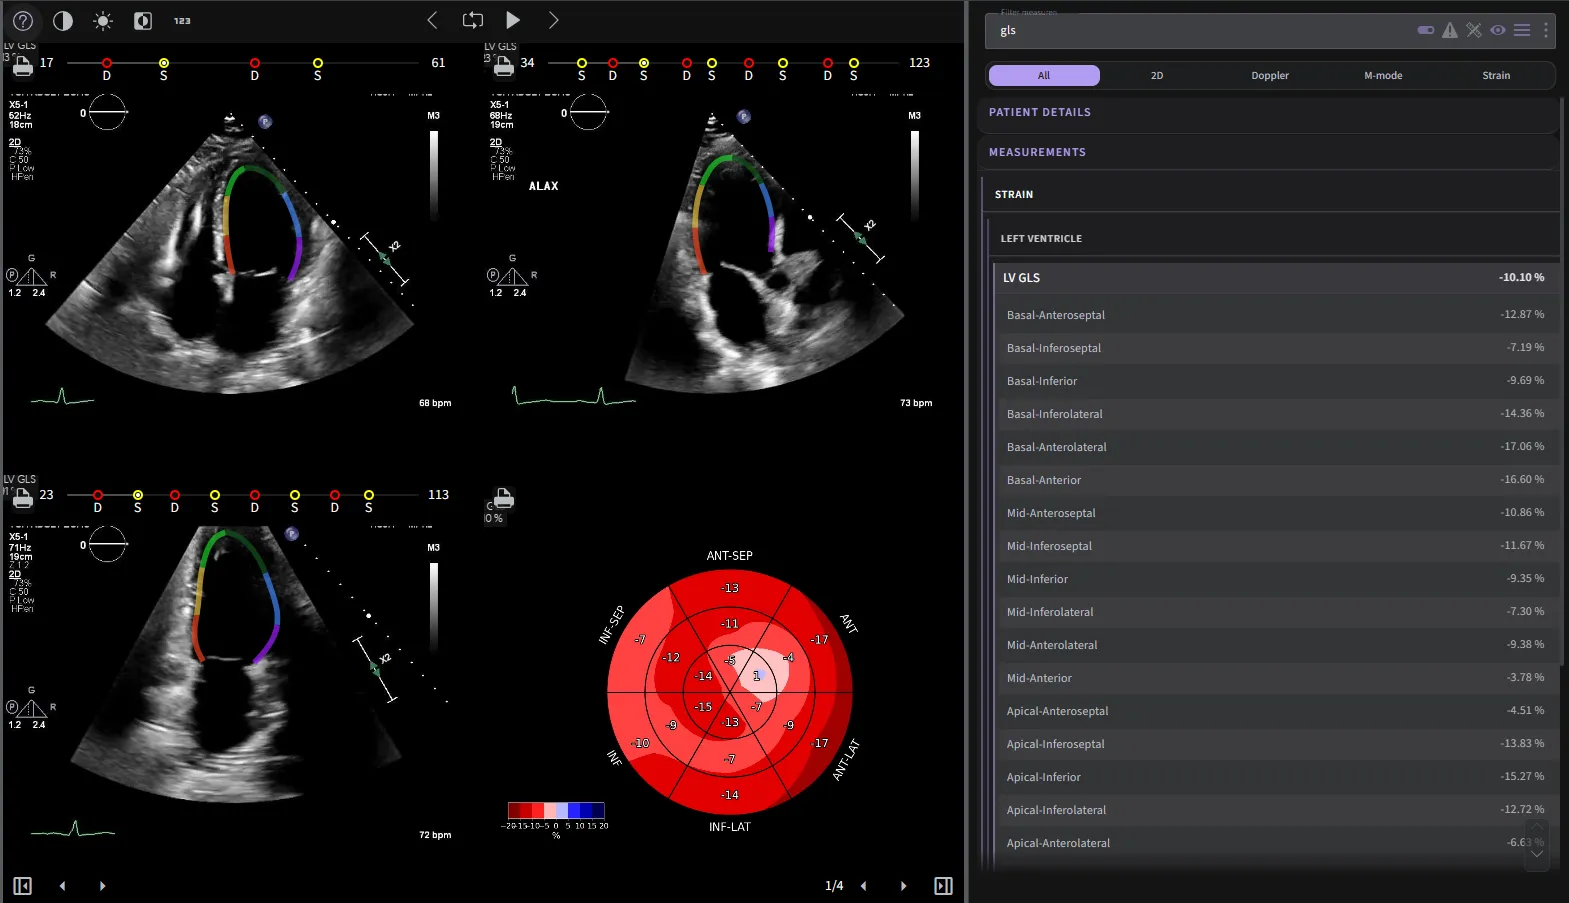
- Adjusting End Diastole Annotation
- To modify the end diastole annotation, click on the letter "D" within the annotation box.
- Adjusting End Systole Annotation
- For end systole annotation adjustments, simply click on the letter "S" within the annotation box.
- Refreshing Strain Calculation
- Once you have made the necessary edits to the end diastole and end systole annotations, click on the "Approve" button.
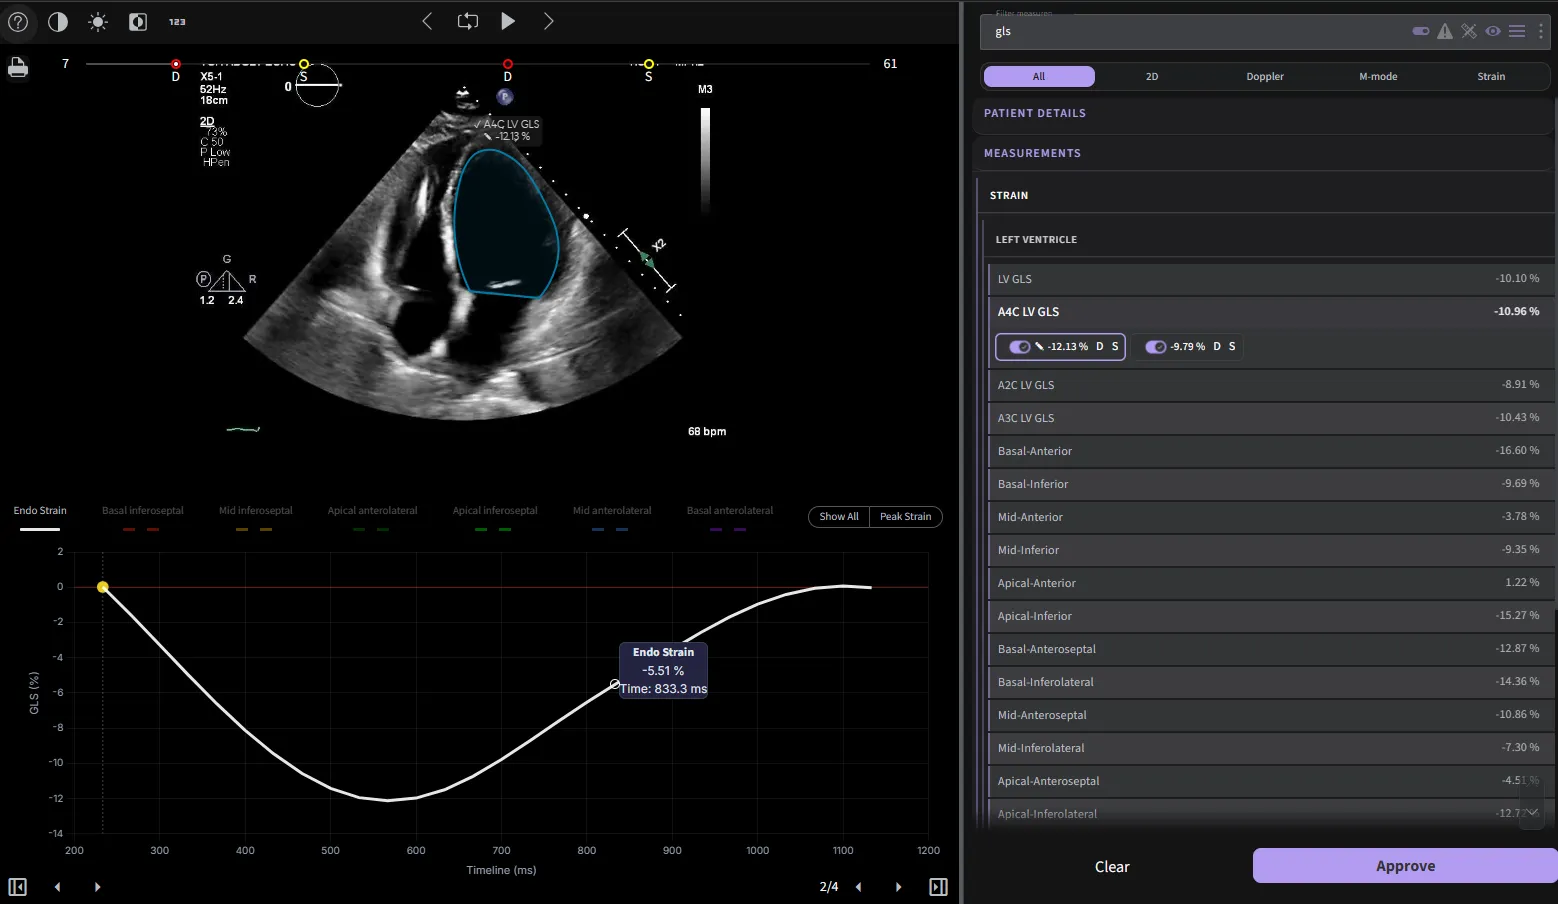
- Once you have made the necessary edits to the end diastole and end systole annotations, click on the "Approve" button.
- Adding New Strain Measurements
- To add new strain measurements, select the "+" sign located within the annotation box. This allows you to include additional strain data for a more comprehensive analysis.
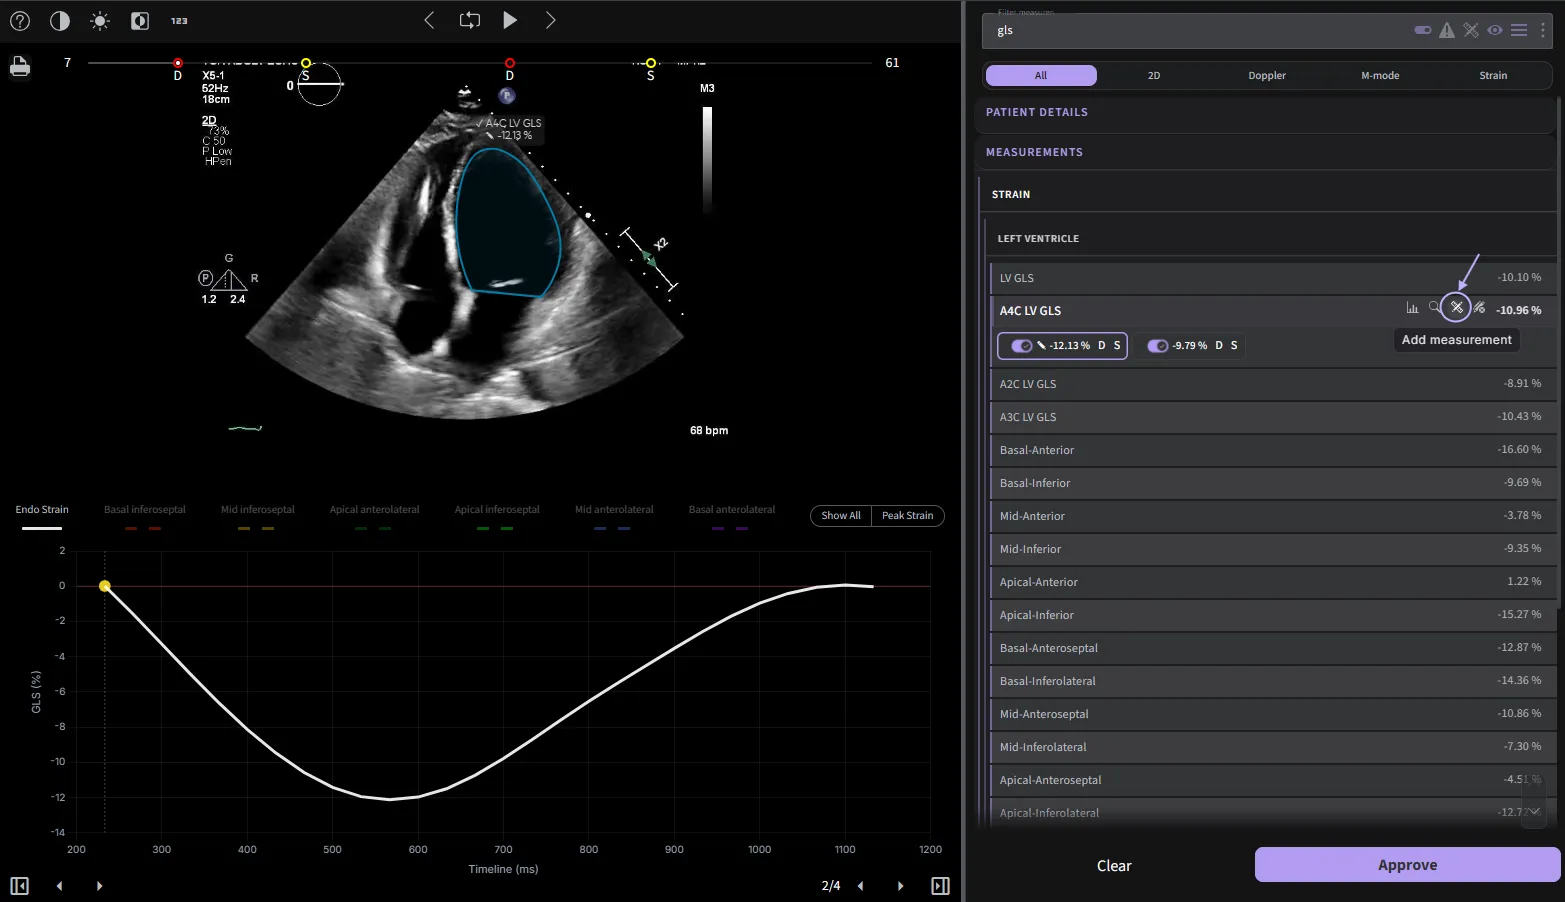
- To add new strain measurements, select the "+" sign located within the annotation box. This allows you to include additional strain data for a more comprehensive analysis.
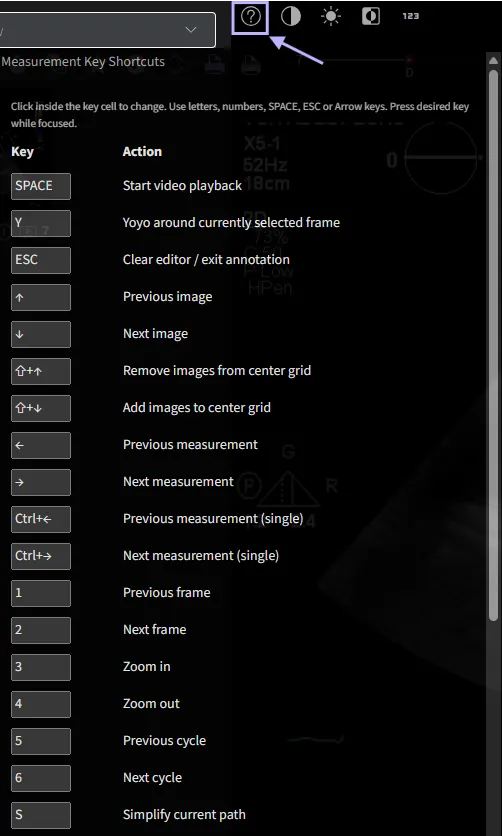
5.5.4 Measurement key shortcuts
Clicking on the question mark icon which located at the bottom right of the screen will trigger a small pop-up that provides a brief description of measurement key shortcuts.
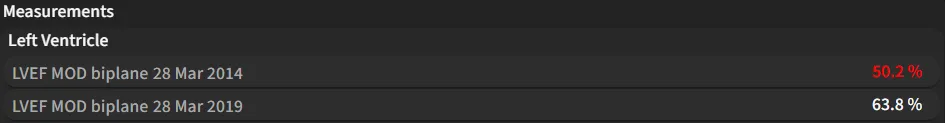
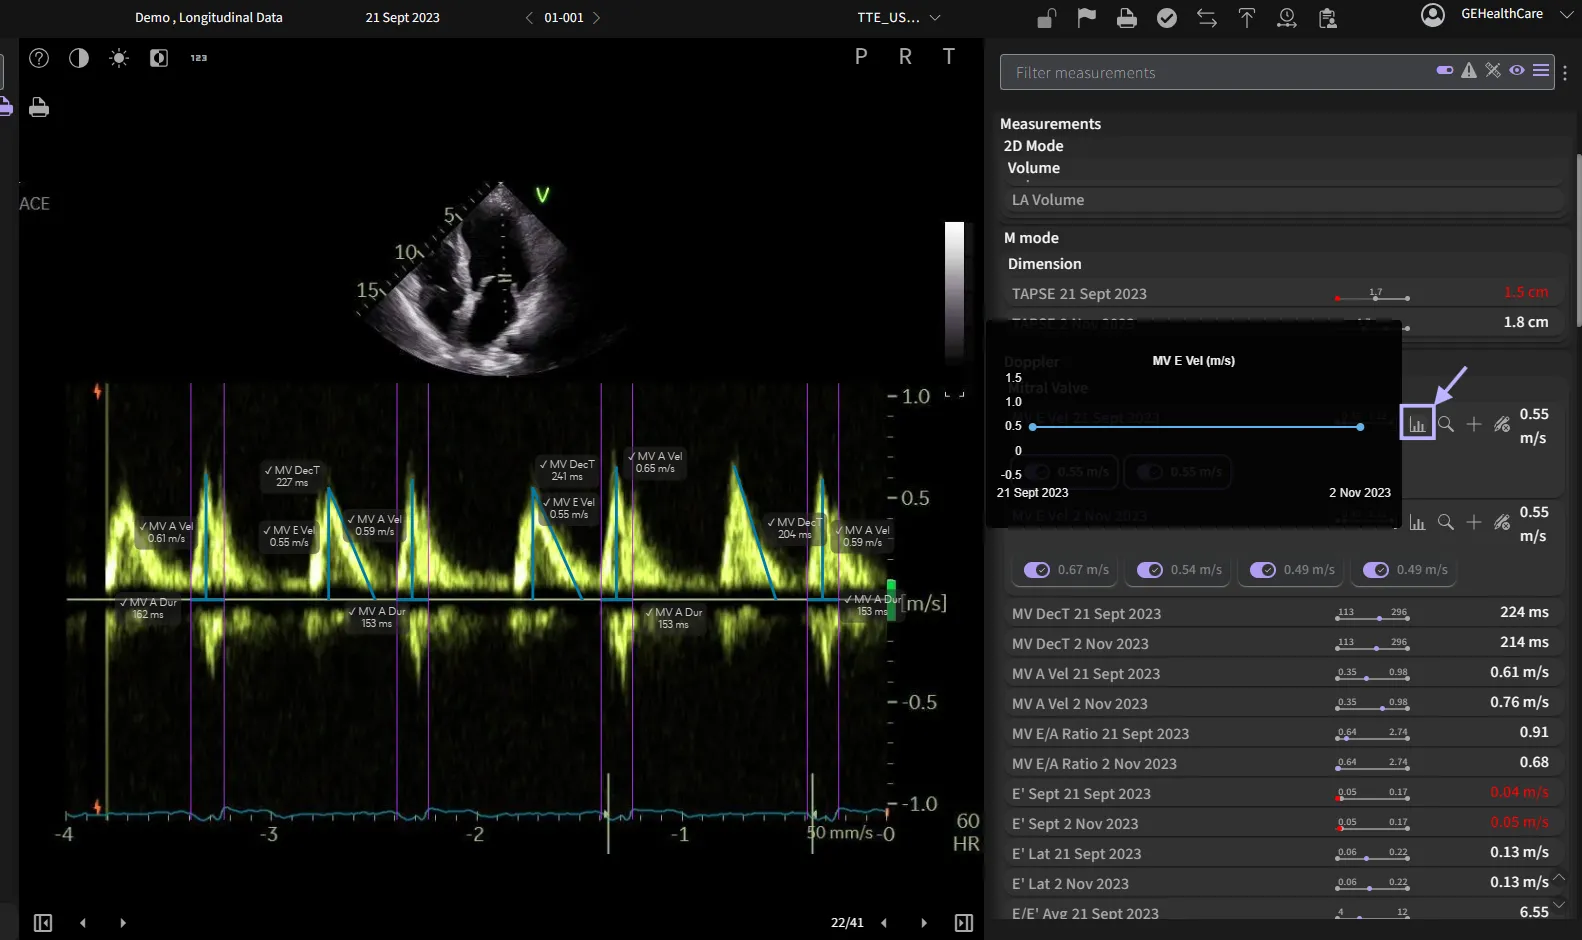
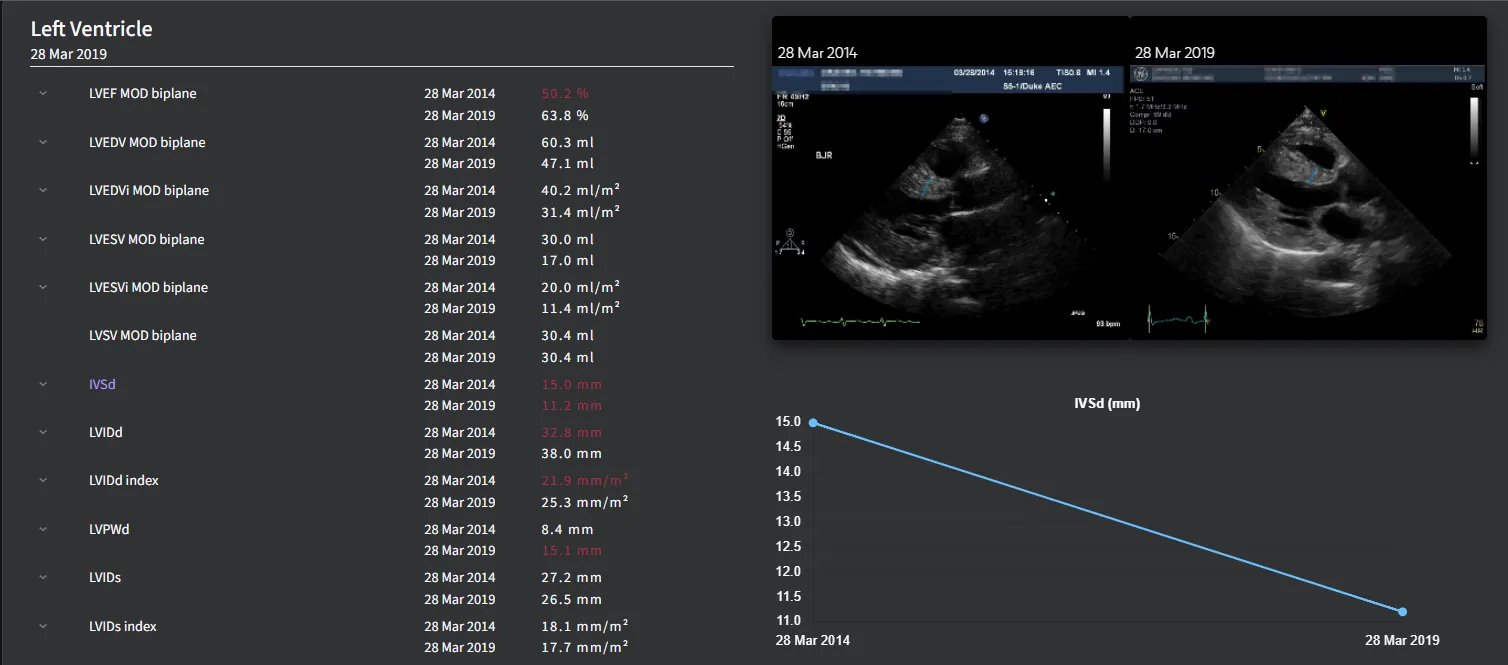
5.5.5 View Longitudinal Data
To view the longitudinal data, simply click on the visits you would like to see.
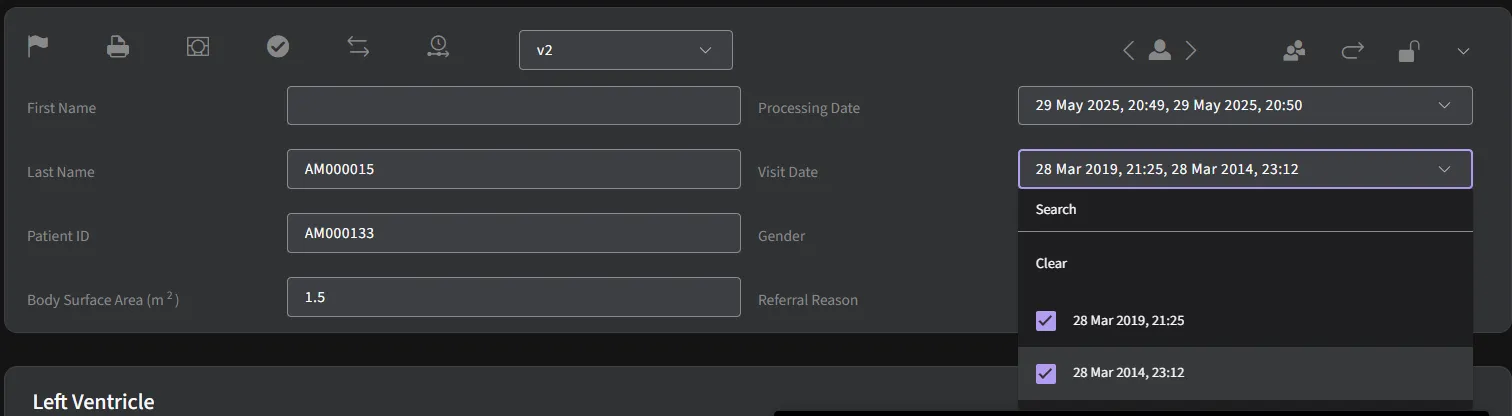
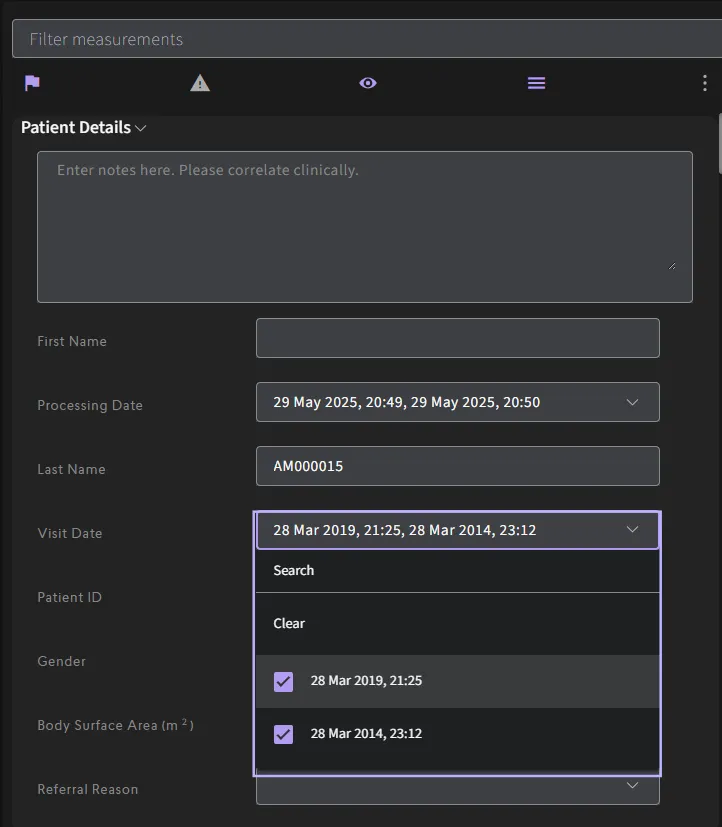
When you hover over the parameter, a longitudinal graph will appear below the preview panel. On the preview panel, the visit dates will be indicated on the images themselves.

5.6 Protocols
You may customize the measurements and findings that appear within the report by editing the respective protocols and selecting the desired parameters to be displayed.
The sequence of the ‘Main findings’ can be adjusted according to user preference by drag and drop to the desired position.
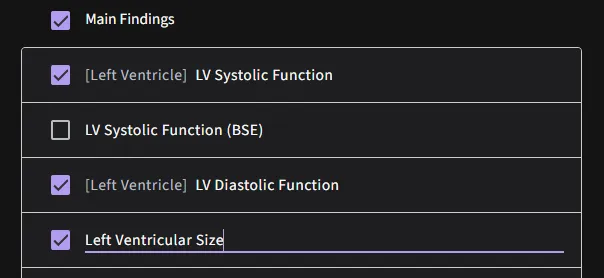
An existing main finding can be renamed.
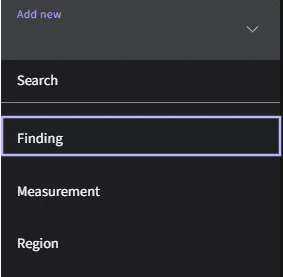
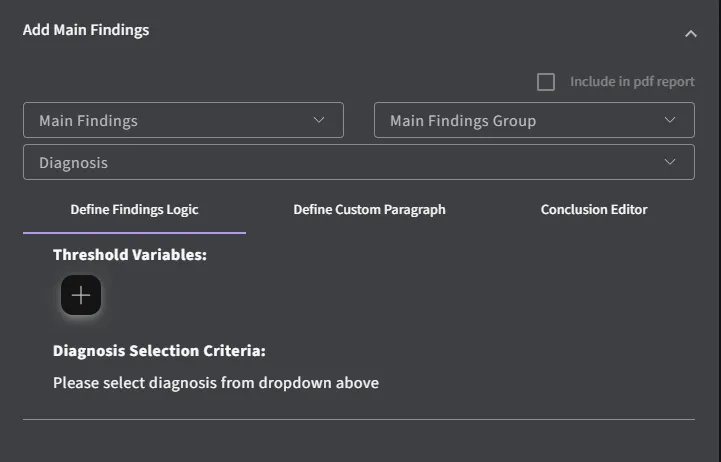
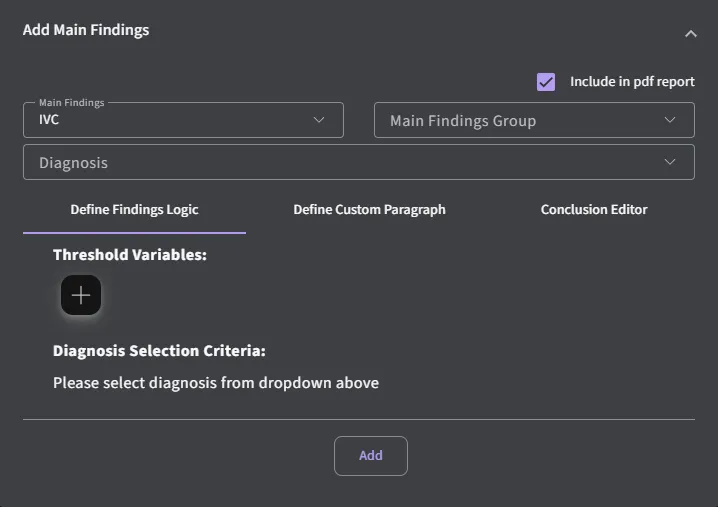
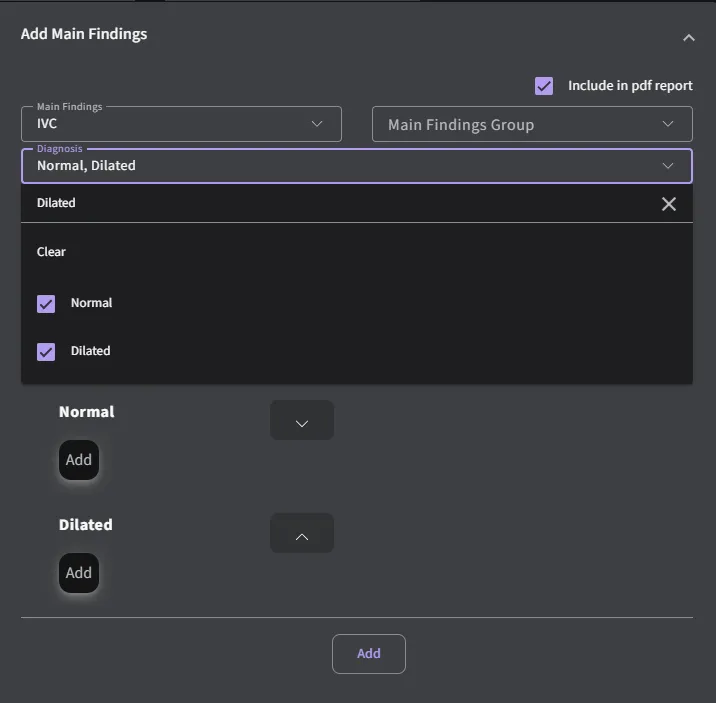
5.6.1 Add Finding
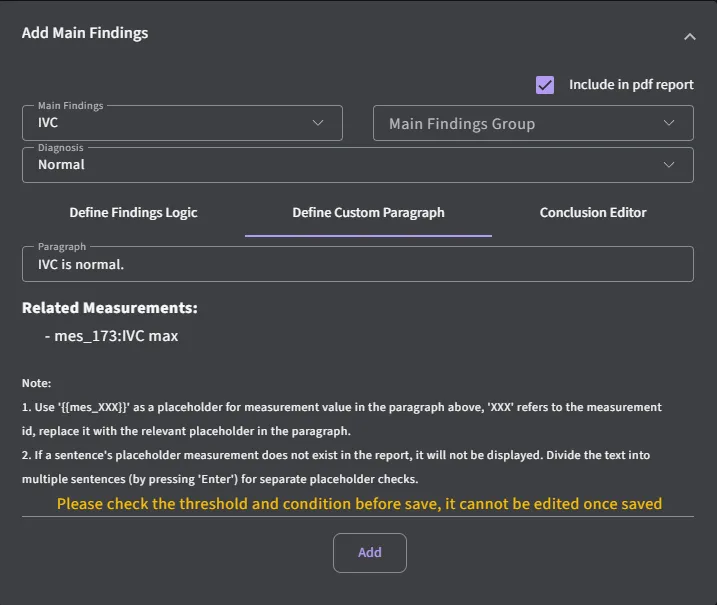
The “Add finding” button allows users to create new finding under the “Main Finding” section in the report. Users can add main finding, select diagnosis outputs, determine threshold variables, set diagnosis selection criteria, and define custom paragraph. Click on ‘Add’ button to save your customizations once completed. Please check the threshold and condition before save because it cannot be edited once saved.
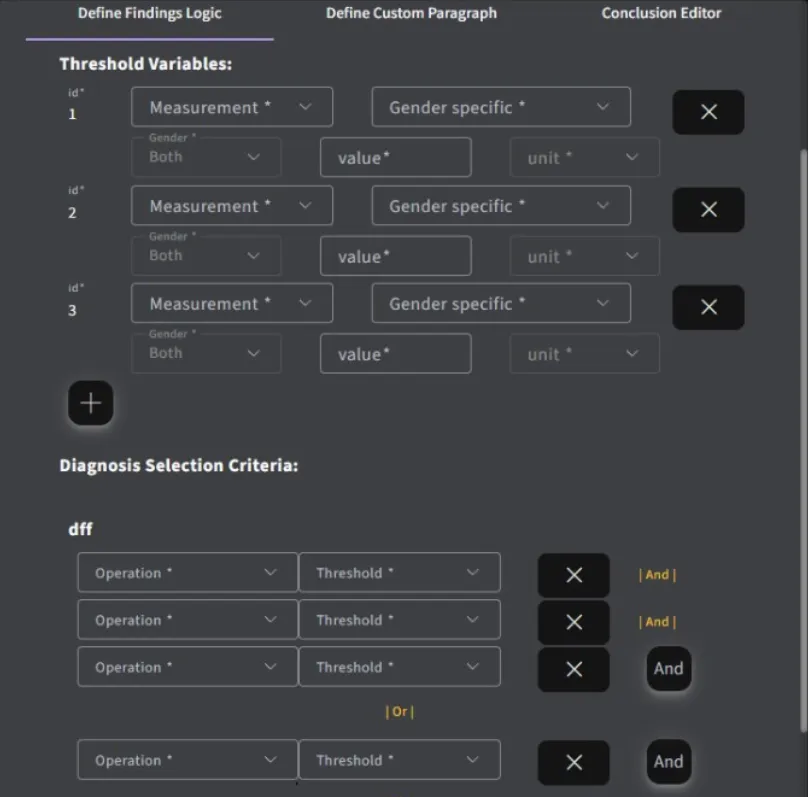
You have the ability to group your customized findings under one main header within the main findings section.
To do this, follow these steps:
- Add sub-headers under “Main Finding” to organize your detailed findings.
- Create a header with your desired title under “Main Finding Group”
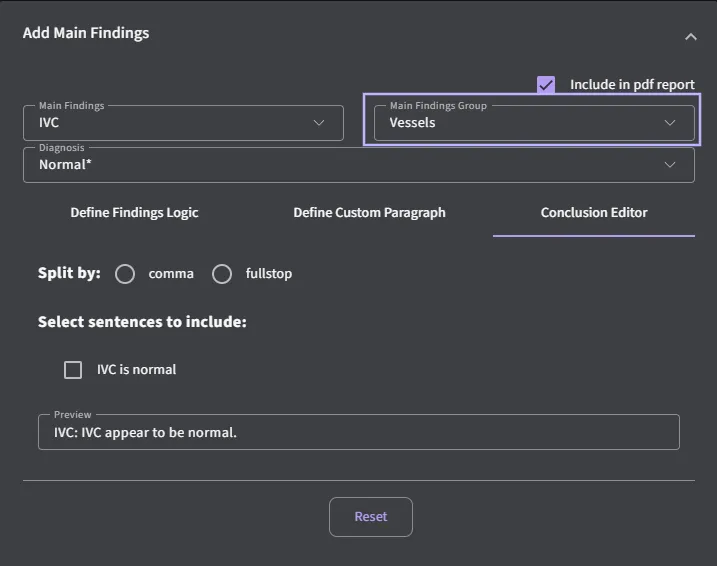
- For each sub-header, define the logic and criteria for diagnosis. Add detailed findings and conclusions under each sub-header.
When you expand the toggle, you will see each sub-header along with its associated customized diagnosis and paragraph.
When you collapse the toggle, each individual sentence from the sub-headers will be combined into a single comprehensive paragraph.
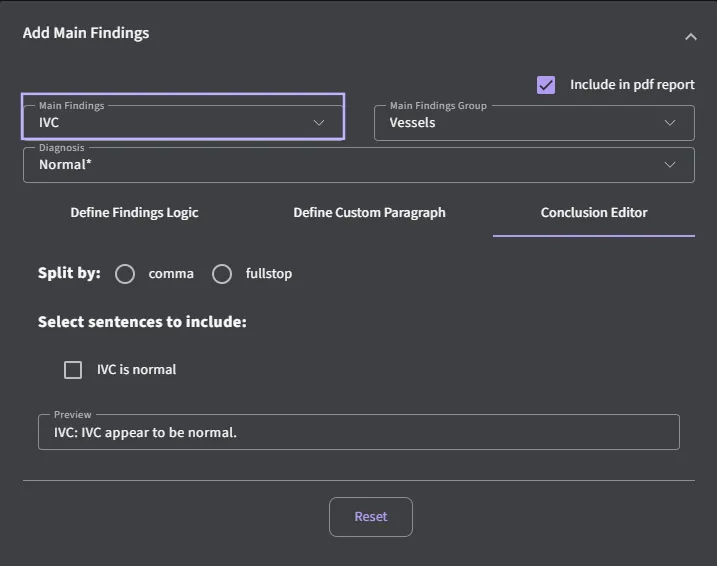
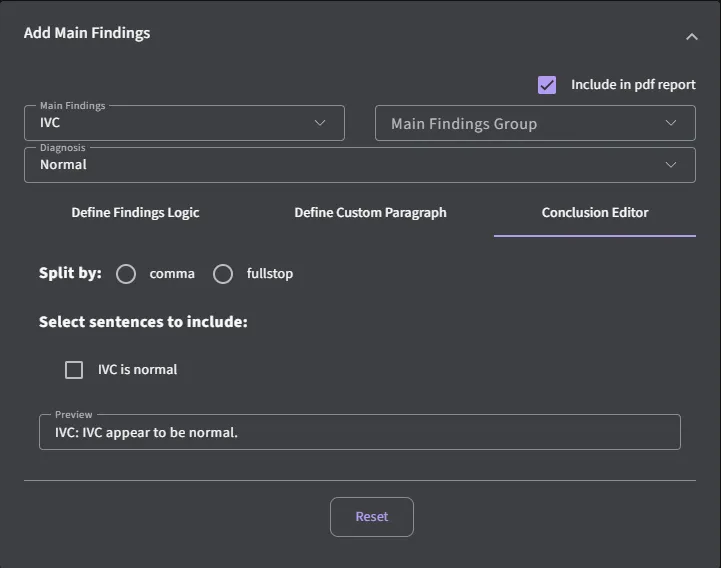
5.6.2 Editable Conclusion
The Conclusion Editor feature allows users to customize content that appears in the Conclusion section of the report and in the printed PDF report.
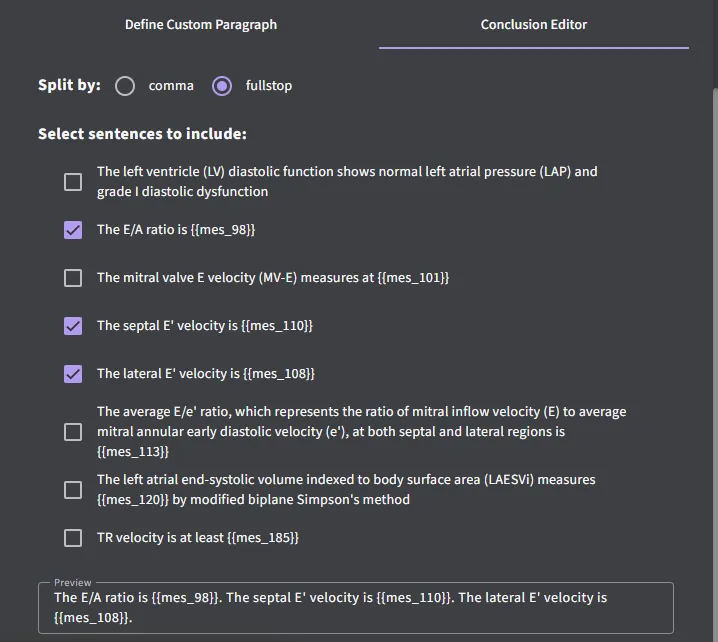
- Navigate to the Conclusion Editor tab
- Split Sentences
- You can split sentences either by comma or full stop.
- How to Select:
- Use the toggle buttons to choose your preferred splitting method.
- Select Sentences to Include
- Users can select predefined findings related to the Define Custom Paragraph category.
- Checkboxes next to each sentence allow you to include or exclude statements in the report.
- Free Text Column
- A free text column is available for each section, allowing users to manually enter custom statements or notes that may not be part of the predefined options. This adds flexibility for tailored reporting when needed.
- Preview Panel
- The Preview section displays the sentences selected for inclusion.
- This allows you to verify the final text before saving or including it in the report.
- Reset Button
- If needed, use the Reset button to clear all selections and start over.
5.6.3 Add measurement and custom calculated measurement
The “Add measurement” button allows users to create and measurement. New measurement can be created, measurement tool (e.g. distance, area, volume) and the units (e.g. mm, cm) for the measurement can be determined. The number of decimal places for each measurement can be specified.
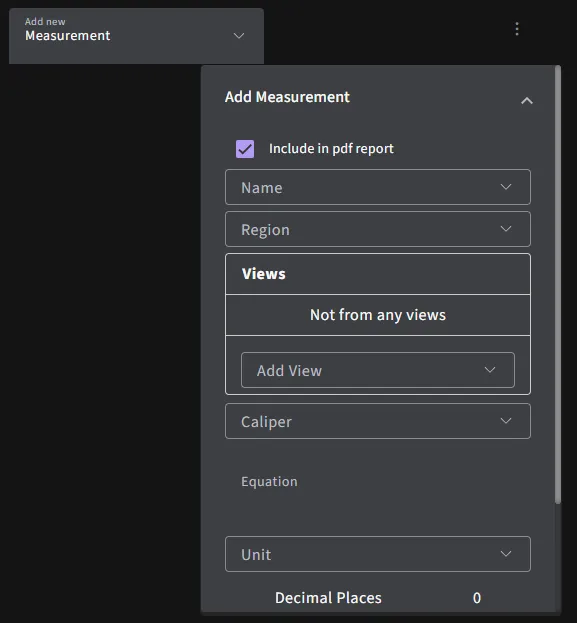
- Add new calculated measurement:
- Click on “Add new measurement” to begin creating your custom calculated measurement
- Define measurement name:
- Enter a descriptive name for your custom calculated measurement.
- Enter equation:
- In the Equation field, input the formula for your calculated measurement. You can use standard mathematical operators and functions.
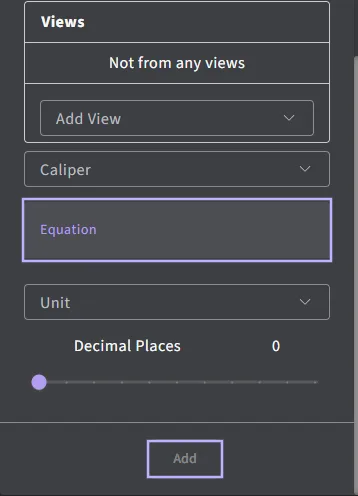
- In the Equation field, input the formula for your calculated measurement. You can use standard mathematical operators and functions.
- Specify variables:
- Define the variables used in your equation. Input names for the variables.
- Save calculation:
- Once you have entered your formula and variables, click “Add” to store your custom calculated measurement. Your new measurement will now be available for use.
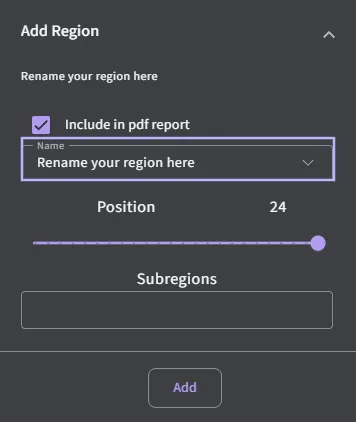
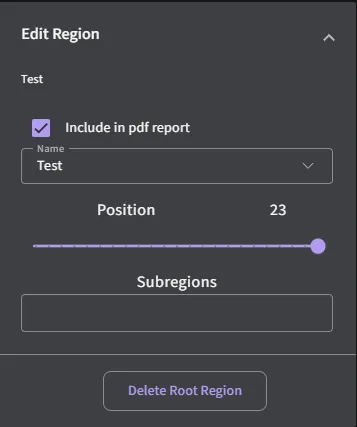
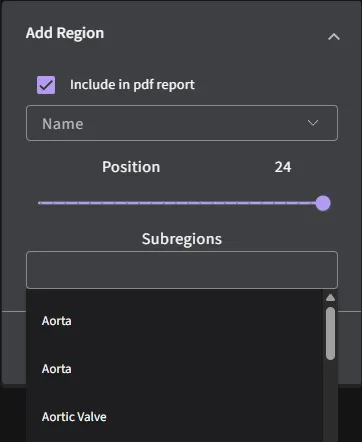
5.6.4 Add Region
A new region can be added by clicking on ‘Add’ button after entering a name.
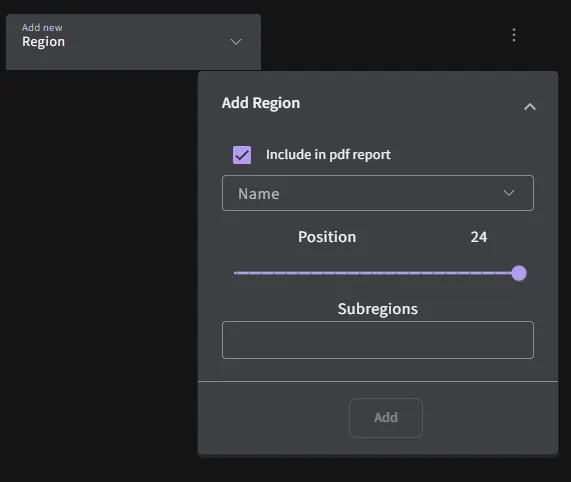
An existing region can be renamed by selecting on the heading and choose the option within the dropdown box.
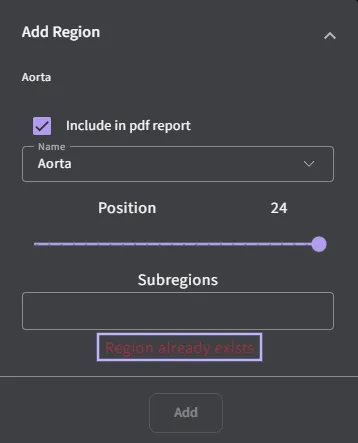
If existing region is detected, a notification will prompt the user.
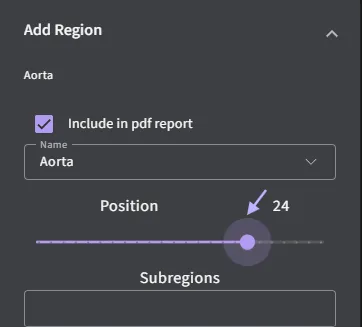
Shifting a region’s position is possible by clicking and dragging the dot along the line.
Region can be removed by selecting on ‘Delete root region’.
A subregion can be created by selecting from a dropdown.
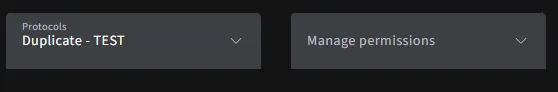
5.6.5 Manage protocol permission
Individual or groups within an organization can be allocated to different protocols via the ‘Manage permission’.
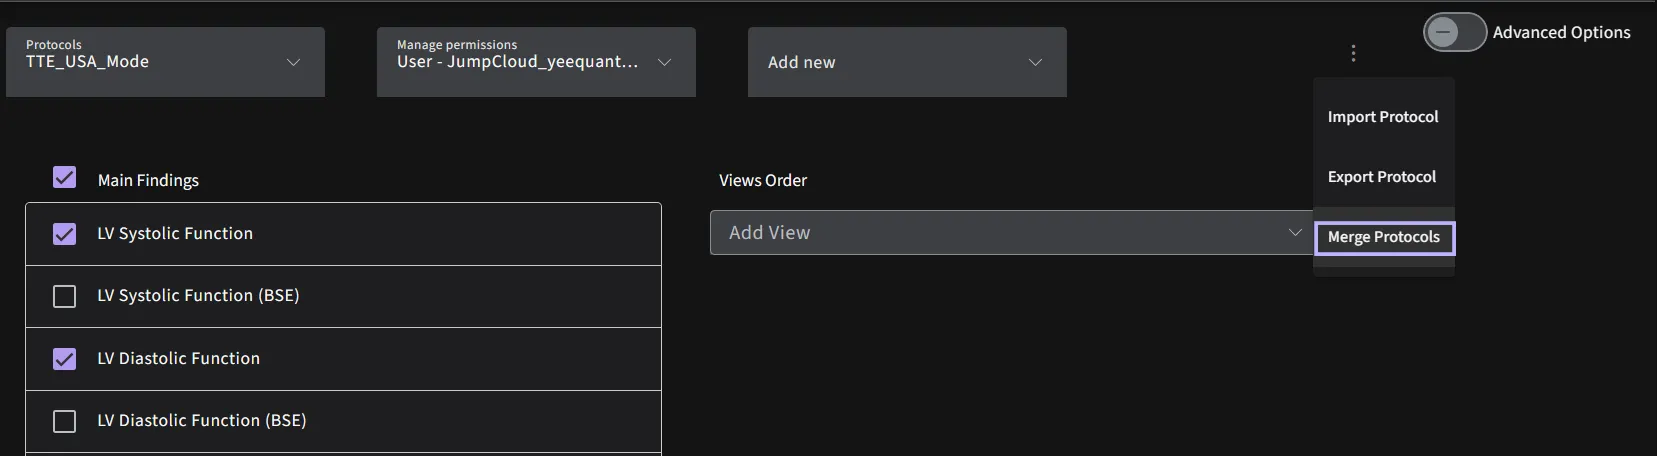
5.6.6 Importing and exporting protocols
Exporting protocols:
Navigate to “Protocols” section
Choose the protocol you wish to export from the list and select the “Export Protocol” option.

A JSON file containing the protocol will be downloaded.
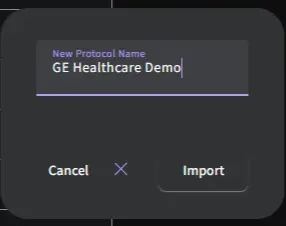
Importing protocol:
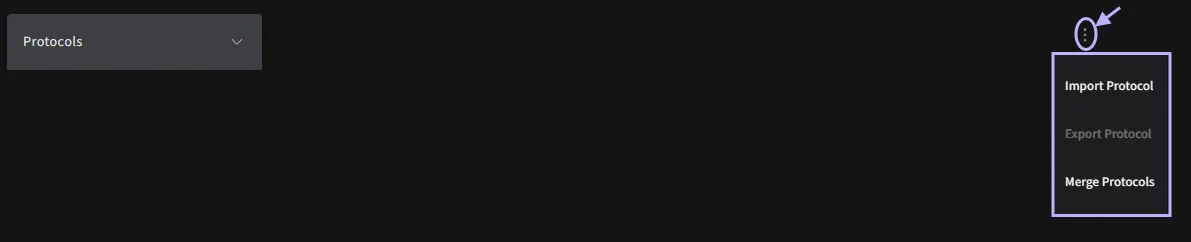
Navigate to “Protocols” section.

Click on the “Import Protocol”.
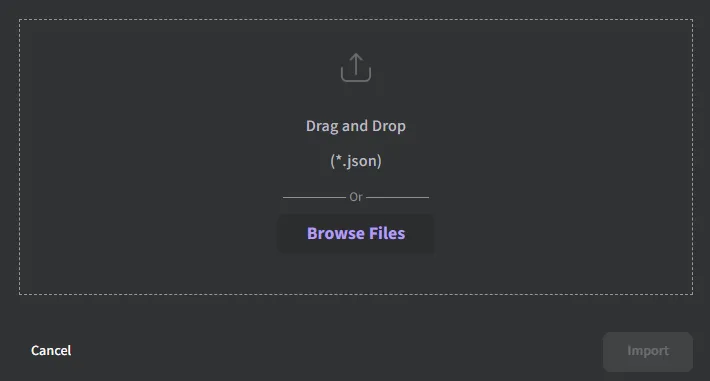
Choose the protocol file from your computer. Ensure the file format is compatible (e.g. json).
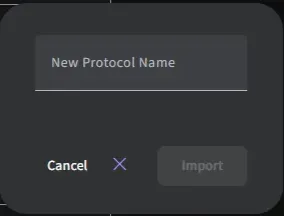
Within the field, provide a new protocol name. Click the “Import” button to initiate the process of importing the newly specified protocol.
Merge protocol:
Click on the “Merge Protocols”.
Enter a new protocol name so the merged protocol can be saved and reused without altering the original protocols.
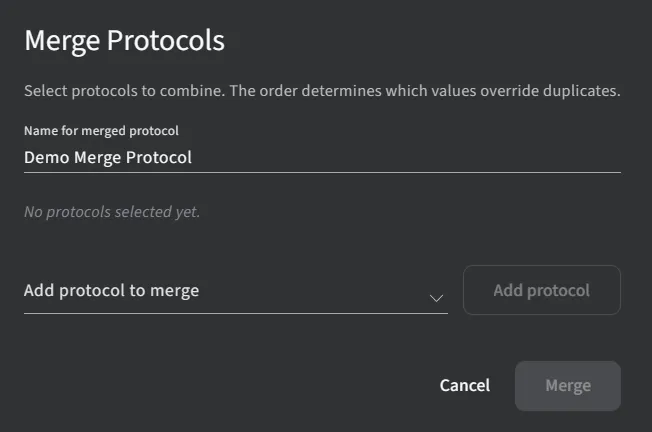
Use the Add protocol to merge control to select each source protocol that should contribute values to the merged protocol.
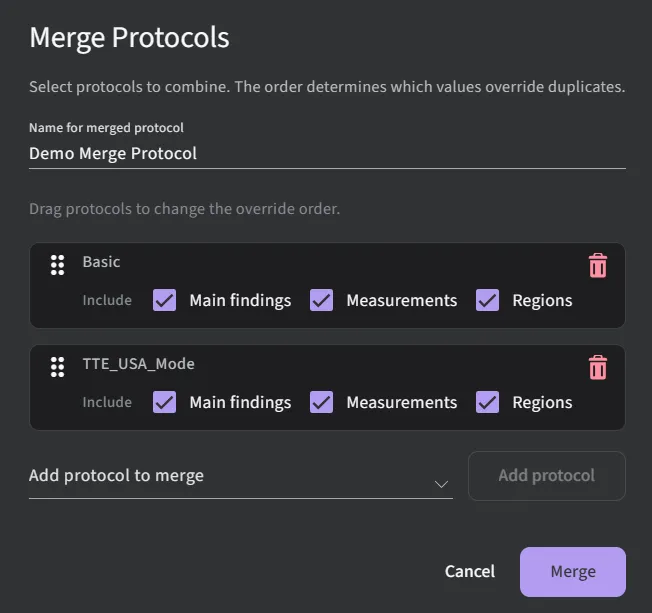
Drag protocols up or down in the list to change their override order, placing the highest‑priority protocol at the top. When duplicate parameters exist, the system reads from top to bottom and uses the first non‑empty value it encounters, so higher‑priority protocols override lower‑priority ones for conflicting fields.
5.6.7 Flagging measurement priority
Once Advanced Options are enabled, you'll be able to choose from the following measurement types:
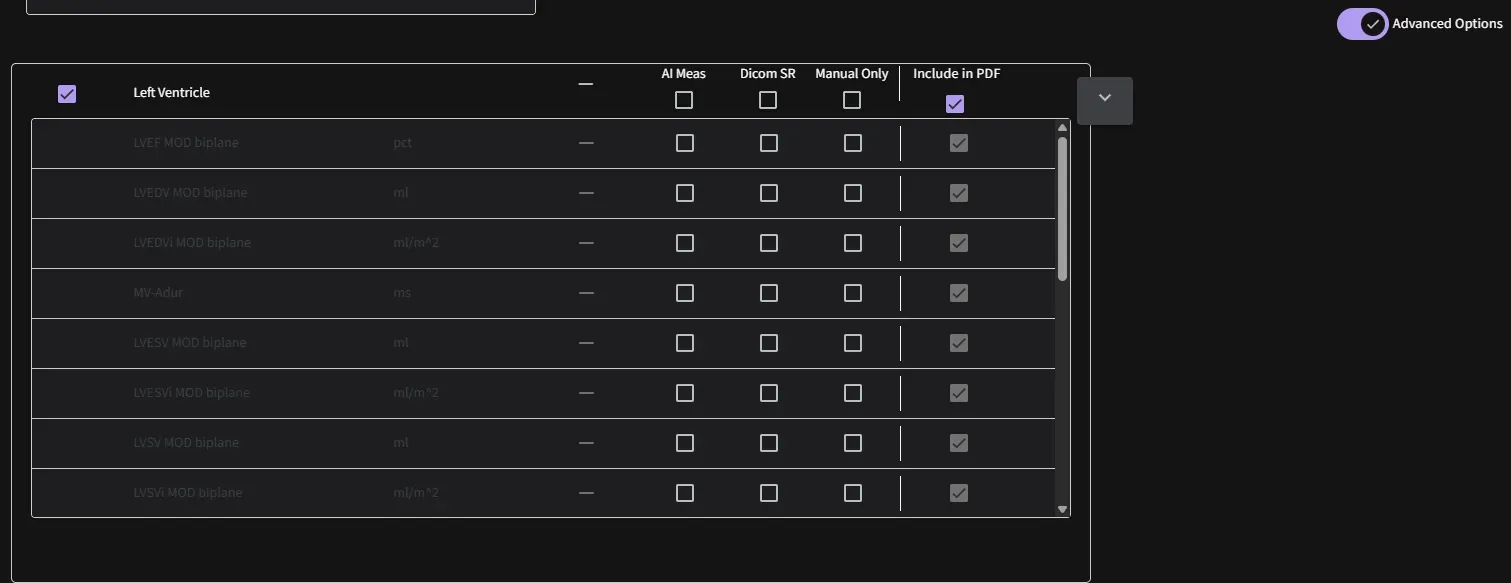
- AI Measurement: Measurements automatically derived by the AI.
- DICOM SR: Measurements imported from a cart-based ultrasound machine via DICOM Structured Reporting.
- Manual: Measurements that allow user to create manually.
Select one or more sequences (1, 2, or 3) to apply these measurement types accordingly.
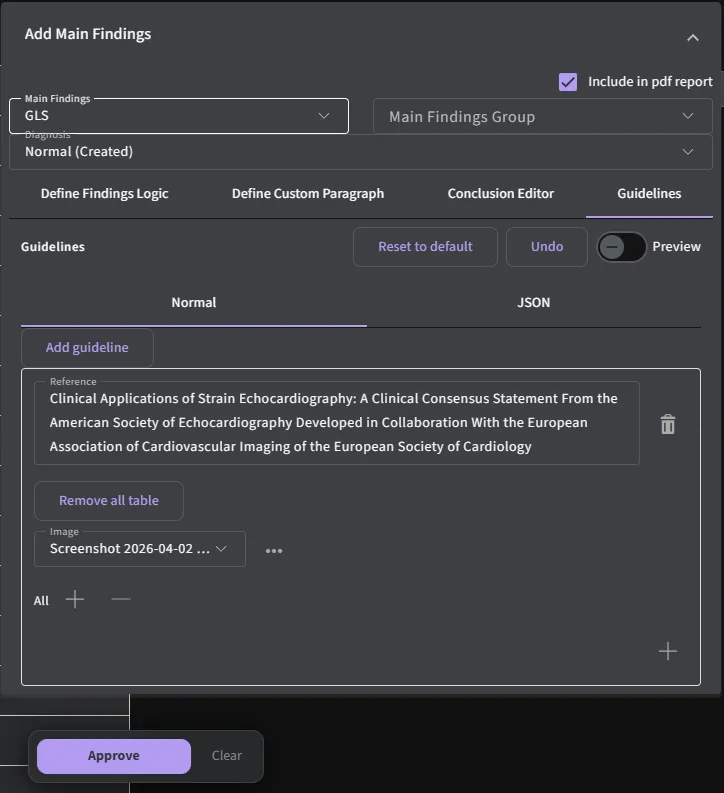
5.6.8 Adding guidelines
To add a custom guideline, navigate to the Guidelines tab within the Add Main Findings section. Click Add guideline to create a new entry, then provide a reference name to define the guideline. You can further customize it by selecting the appropriate reference tables (e.g., all, male, or female) based on your requirements. Once added, the guideline will be applied to support structured interpretation and reporting. Use the preview option to review how the guideline will appear in the final output before saving.
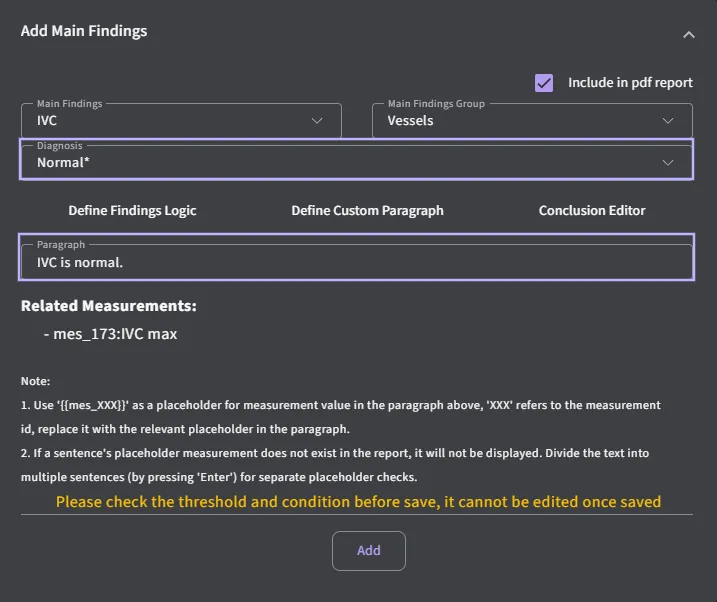
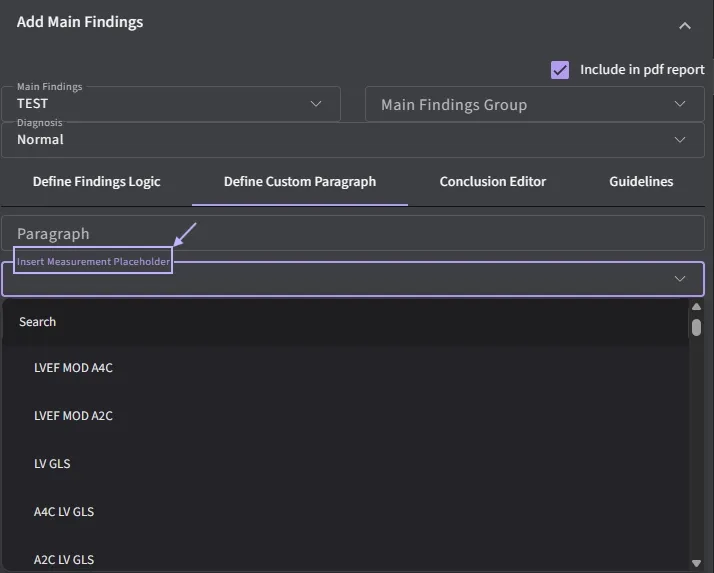
5.6.9 Adding measurement placeholder
To insert a measurement placeholder, use the Insert Measurement Placeholder dropdown within the Define Custom Paragraph section. Select the desired measurement from the dropdown list, then click on the corresponding measurement chip (e.g., mes_125 LV EF MOD biplane) to automatically insert its placeholder into the paragraph field. The placeholder will appear in the correct format and can be positioned within the text as needed to dynamically populate values in the final report.
5.7 Settings Page
The settings page allows you to view and customize your profile.
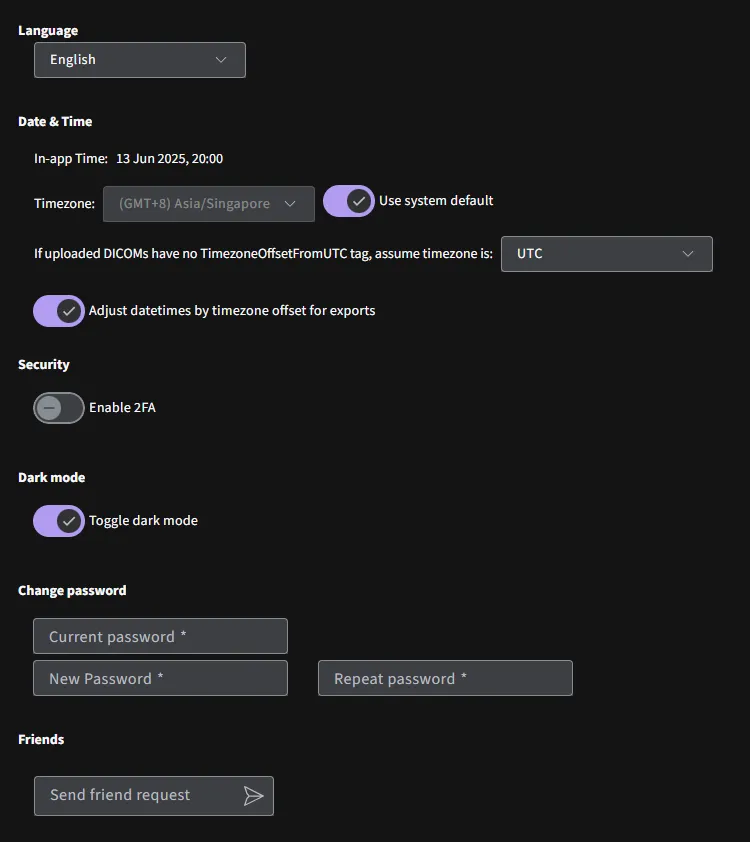
5.7.1 User Profile
Under the Profile tab, you will be able to do the following,
- Edit user details
- Change the language
- Enable 2FA for increased security
- Toggle the app to Dark mode
- Change password
5.7.2 Subscription
Under the subscription tab, you may view your subscription information and choose whether to opt out of ViewPoint EchoPilot ’s collection of user data to help with our continuous improvement efforts by allowing ViewPoint EchoPilot algorithms to learn and improve data processed and edits to the annotations. No personal identifiable information will be used.
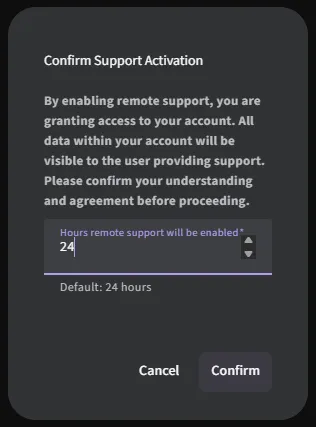
5.7.3 Remote Support
You have the capability to grant remote support access to facilitate assistance for admin. When you initiate this process, you will receive the following notification message:
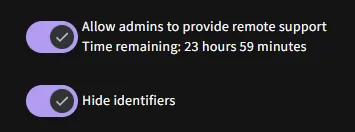
Choose the duration of support. You can extend the support duration beyond the default 24 hours if needed.
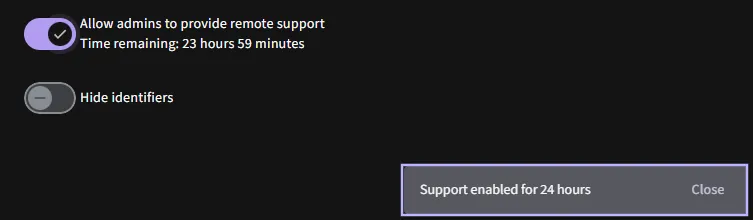
Upon confirmation, a banner will appear indicating that remote support is active for the specified duration. You have the choice to hide identifiers to enhance privacy during the support session.
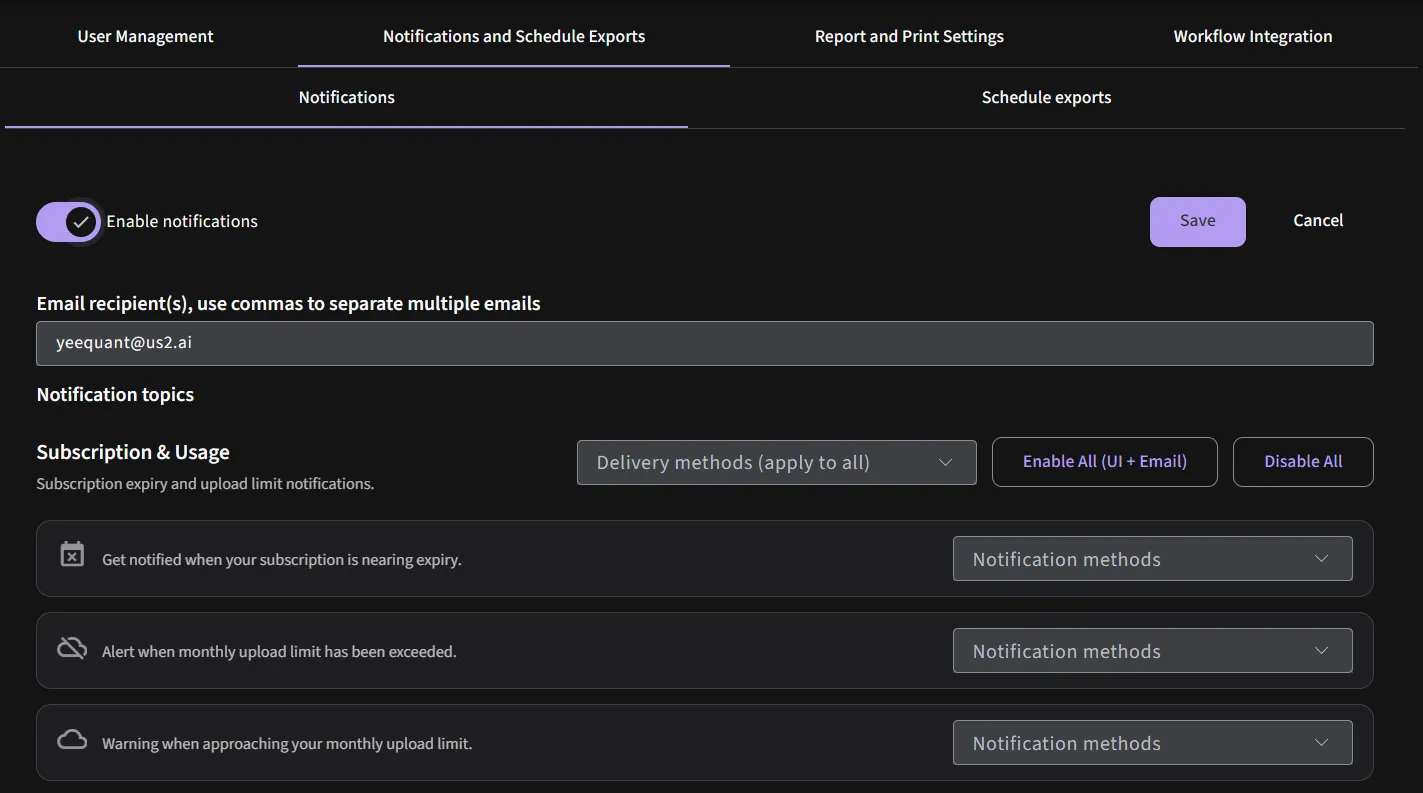
5.7.4 Notifications
Notifications can be configured by category, and each category can use one or more delivery methods: in‑app, email hourly, or email immediately
Notification categories
- Subscription & Usage: Alerts for subscription expiry and approaching or exceeded upload limits.
- Study Processing: Status messages for study upload completion, review readiness, and report finalization.
- Projects & Trials: Updates when assignments change, users are added or removed, or permissions are modified for specific projects or clinical trials.
- Tasks: Notifications when tasks are assigned to you, returned for review, or approved or rejected.
- System & Security: System health and security alerts such as sync or webhook failures and key security events.
- General: Other information messages that do not fit into the above categories, such as product updates or maintenance notices.
Notification methods
- Show in app: Displays notifications within the application interface, typically as badges, banners, or a notification center.
- Email hourly: Bundles new notifications into a digest sent approximately once per hour, reducing email volume while keeping users up to date.
- Email immediately: Sends an email as soon as a triggering event occurs, suitable for time‑sensitive items such as security issues or critical task updates.
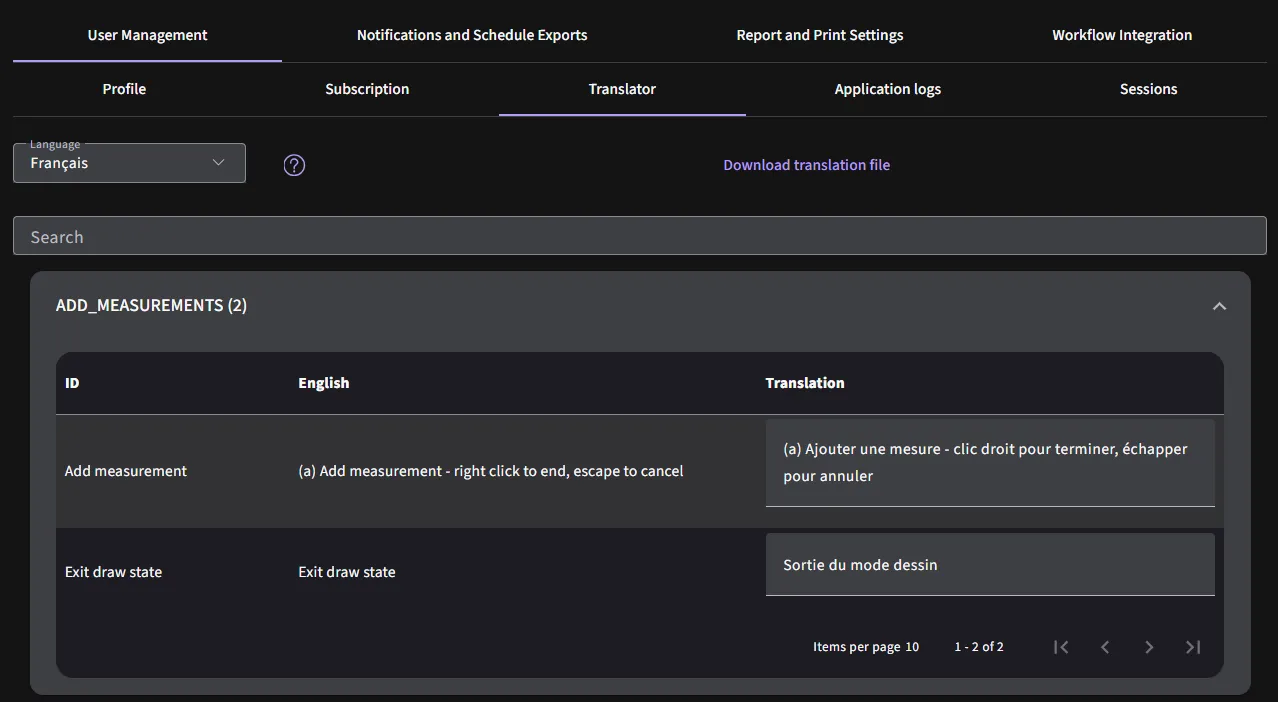
5.7.5 Translator
In the event where you think our translator is incorrect, you may manually correct the translations.
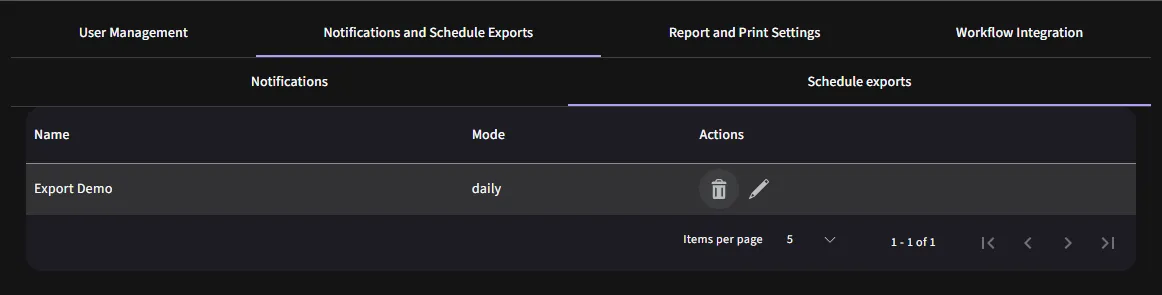
5.7.6 Schedule exports
The “Export scheduling” feature allows you to automate the process of exporting data, ensuring timely and consistent deliveries. The following can be managed during export scheduling, such as specify email recipients, frequency, start date and time.
5.7.7 Setting up export schedule
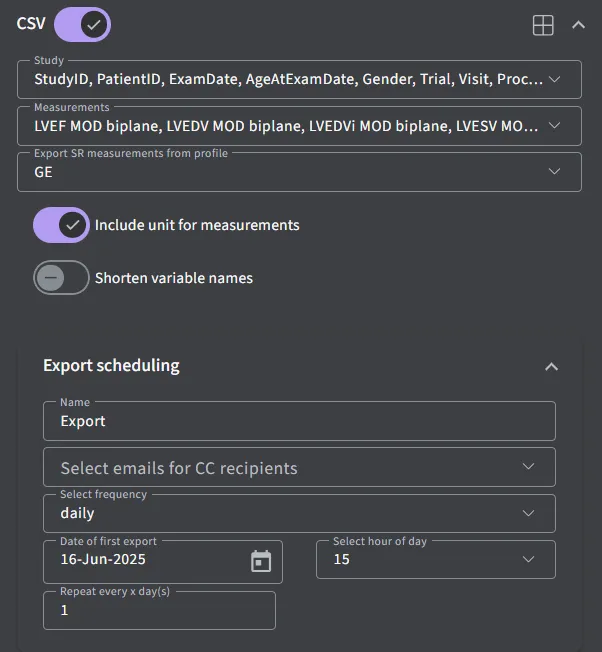
- Export name:
- Enter a name for your export schedule in the “Name” field. For example, you might use “Monthly Echo Report” to easily identify this export.
- Enter email for CC recipients:
- In the “Select emails for CC recipients” field, enter the email addresses that should receive a copy of the export.
- Select frequency:
- Choose how often the export should be generated. Options typically include daily, weekly, monthly and yearly.
- Date of first export:
- Specify the date of first export. Click on the date field and select the desired start date from the calendar
- Select hour of day:
- Choose the hour of the day when the export should be executed. Use the “Select hour of day” field to input the hour in 24-hour format.
- Repeat every X week:
- Set the frequency of repetition in weeks. For weekly reports, you might enter “1” to repeat every week. Adjust this number if you need a schedule exports at different intervals, such as every 2 weeks.
- Save schedule:
- Click “Export” to store your export schedule. Your configuration will now be applied, and exports will be generated according to the specified settings.
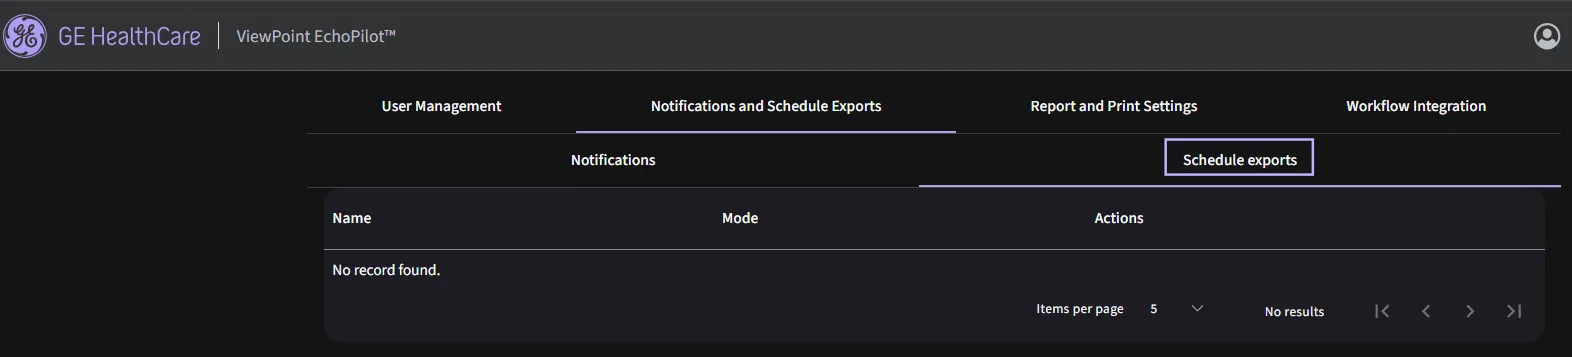
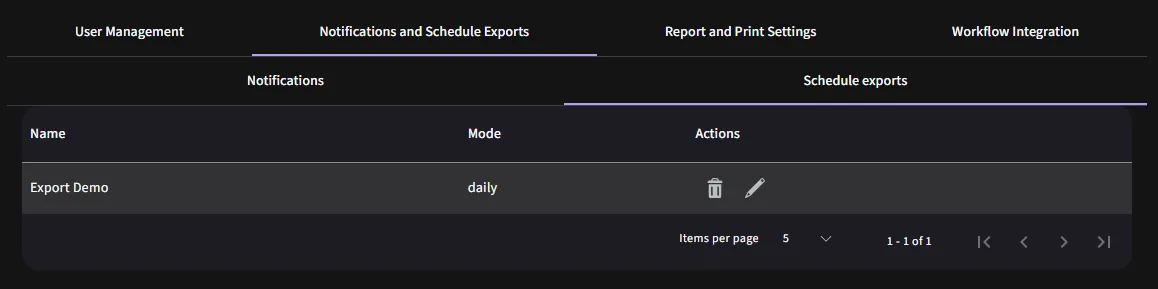
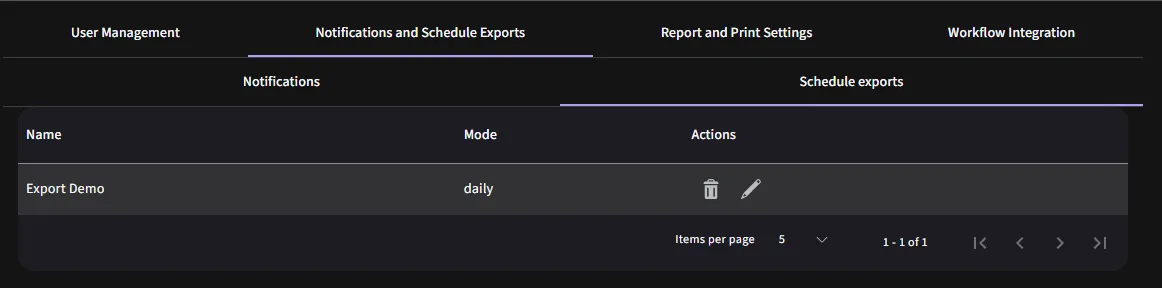
5.7.8 Managing and editing export schedules
- Edit existing schedule:
- To modify an existing export schedule, go to “Schedule exports” page, select the schedule you wish to edit, and update and necessary fields.
- To modify an existing export schedule, go to “Schedule exports” page, select the schedule you wish to edit, and update and necessary fields.
- Delete schedule:
- If you need to remove a schedule, select the schedule from the list and click “Delete”.
5.7.9 Monitor User Sessions
This section monitor and manage active user sessions, ensuring account security and proper session
control.
Session Table Overview:
The session table provides detailed information about each active session for the user account.
| Field | Description |
| IP Address | The IP address of the device accessing the account. |
| Location | Geographical location (if available). Displays "Unknown" if location tracking fails. |
| Browser | The browser used for the session (e.g., Chrome 131.0.0). |
| Device | The type of device accessing the session (e.g., PC). |
| Operating System | Operating system of the device (e.g., Windows 10). |
| Token Use | Purpose of the session |
| Creation Time | The date and time when the session was initiated. |
| Expiry Time | When the session will automatically expire. |
| Latest Activity | Timestamp of the most recent action in the session. |
| Invalidate | Status showing whether the session has been invalidated (Yes/No). |
| Active | Indicates if the session is currently active (Yes/No). |
| Action | Allows manual termination of a session using the X button. |
5.8 Help Page
If you require a refresher on how to use certain features of the application, you may go to the ‘Help’ page from the dropdown from your username and select from the various modes of help ViewPoint EchoPilot can provide you with.
You may contact us directly through our contact information.
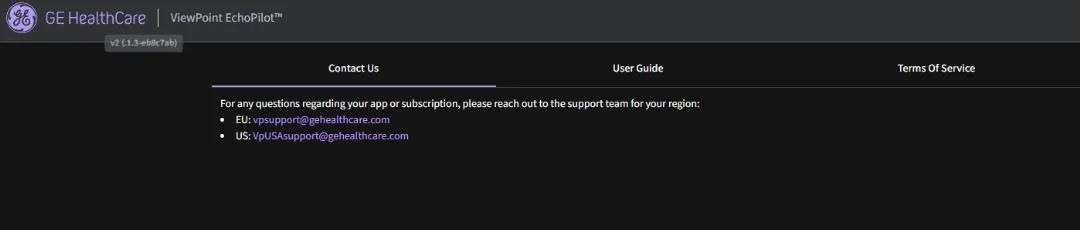
Various languages of the User Guides are also available to you through the ‘User Guide’ tab.
You may also review ViewPoint EchoPilot’s Terms of Service through the link provided.
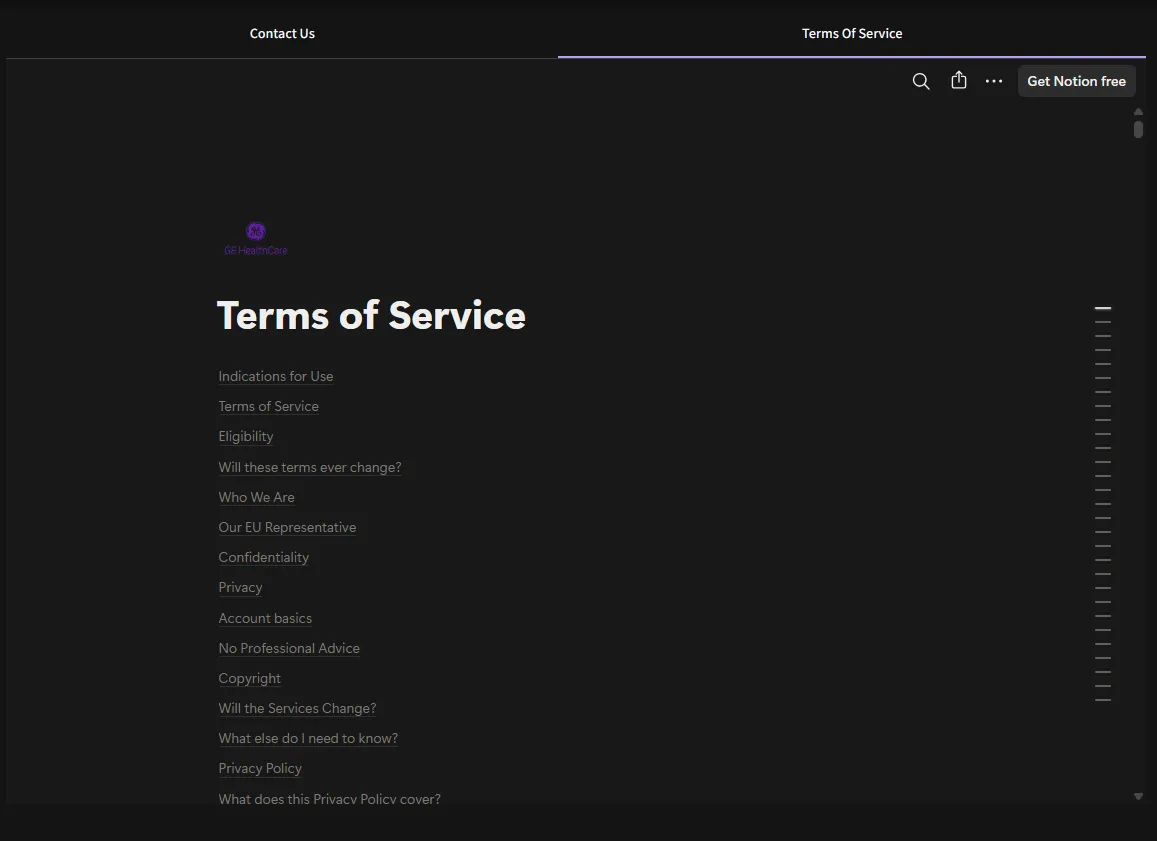
5.9 Admin Dashboard
You may get to the Admin Interface through the following methods if you are the assigned subscription admin of the account,
- Navigate to Admin
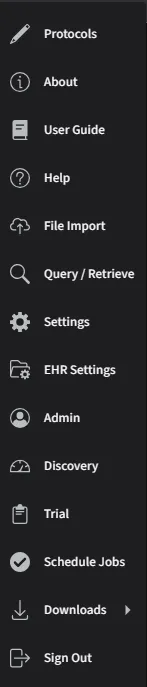
5.9.1 Creating a new subscription
Users on the application require a subscription, you can create a subscription to onboard a new group of users to keep track of their uploads and manage their protocol access.
- Navigate to Admin
- Navigate to Subscriptions tab
- Create New Subscription: Click ➕ to “Create New Subscription”
- Fill in the Subscription Details:
Field Demo account Paid account Display Name Required Required Partner N/A Required Subscription Expiry Set short demo validity (e.g. 1 or 2 months) Set per contract term S3 Bucket Controls whether users in the same account can see each other’s uploads. NO (default) - Users see only their own uploads. - Recommended for healthcare and any real patient data. NO (default) - Users see only their own uploads. - Recommended for healthcare and any real patient data. Hardware ID N/A N/A Region Required Required Study Limit Required, low predefined options Required, set per contract term Protocols Auto-set by system based on your region input Auto-set by system based on your region input Access Level Restricted (e.g. Basic only) Full set (Basic / Standard / Advanced / Custom) Admins 1-2 predefined (system auto-assigns you as admin); optional list Required: for account managers Demo Data Required Optional: Only if requested for training Below are the access level and their permissions:
5.9.2 Adding Users to the Subscription
This is for creating a new user under an existing subscription.
- Click ➕ to add a new user
- User ID: Username for the new user
- Email: Email of the new user
- Temporary Password: Temporary password for the new user
- User Role (Optional): Assign the appropriate user role
User roles can be assigned in two ways:
- At the Subscription Level:
Roles like Support or Admin can be assigned to an entire subscription group, granting those permissions to all users within that subscription.
- At the Individual User Account Level:
Roles can also be assigned or modified for individual users directly, allowing for more granular control based on specific user responsibilities.
Permissions Support Clinical Admin Staff Sonographer Cardiologist Local Administrator View reports ✅ ✅ ✅ ✅ ✅ View images ✅ ✅ ✅ ✅ ✅ Print reports ❌ ✅ ✅ ✅ ✅ Amend demographic data ❌ ✅ ✅ ✅ ✅ Edit image / measurement ❌ ❌ ✅ ✅ ✅ Edit report text ❌ ❌ ✅ ✅ ✅ Edit Flag ❌ ❌ ✅ ✅ ✅ Approve reports ❌ ❌ ❌ ✅ ✅ Delete exams ❌ ❌ ❌ ✅ ✅ Delete exams permanently ❌ ❌ ❌ ❌ ✅ Edit Protocols (within allowed protocols) ❌ ❌ ❌ ❌ ✅ DICOM TLS management ✅ ❌ ❌ ❌ ✅ DICOM Router management ✅ ❌ ❌ ❌ ✅ User management (+/-) ✅ ❌ ❌ ❌ ✅ Password reset for other users ✅ ❌ ❌ ❌ ✅ - At the Subscription Level:
- Select “Send email”: Invalid if is on-premises solution
- CC emails (Optional): Include your own email as well as other team member’s email to also receive a copy of the onboarding email
- A customize email section will appear with a templates dropdown
- A “Default Email” entry will be pre-filled
- To create a new template, click the dropdown and start typing a name for the new template
- By default the template will be linked to the subscription (so all subscription admins can manage and use the template), or you can choose to switch it to be stored locally for only your own use using the toggle on the right of the templates dropdown.
- To send the email to secondary addresses, there is the CC Emails input, where you can enter emails to CC to. All changes to subject, CC, body and attachments are saved as part of the email template.
- Batch import new users (Optional)
- Click “Download CSV Headers” for base CSV file
- Input email, username and temporary password for each user in CSV file
- Click “Upload New Users” to upload CSV file to import all new users in the file
- Verify number of users found and click “Import” to finish the process
5.9.3 User Account Management
Each user account in the application comes with the following actions and capabilities:
| Icon | Action | Description |
|---|---|---|
| Pencil | Edit user data | Change the information in the user’s profile. |
| User in a frame | Impersonate user | View the application from this user’s perspective for diagnostics/support purposes. |
| Gear with arrow | Reset password | Send an email to reset the password. |
| Clipboard | Edit user trials | Change the user’s access to a trial. |
| Up/down arrows | Export/import settings | Transfer settings by downloading or uploading a JSON file. |
| User with a padlock | Deactivate user | Temporarily block access without deleting the account. |
| Bin with an X | Delete user | Permanently remove the user and their data. This action is irreversible. |
5.9.4 Subscription Account Management
Each subscription account in the application comes with the following actions and capabilities:
| Icon | Action | Description |
|---|---|---|
| Pencil | Editing a subscription | Change the details of an existing subscription, such as term/duration, protocol type, or user assignments. |
| Bin with X | Deleting a subscription | Permanently remove a subscription from the app. |
| Document | Review the Audit Trail for the subscription | Review the log of all actions and changes related to the subscription, including edits, deletions, and user activity, for traceability and compliance. |
5.9.5 User Settings Management (Optional)
The User Settings Management tool is designed to help you replicate environment configurations across different accounts with just a few clicks. Instead of manually re-configuring every new user, you can simply migrate settings from an existing profile to another subscription group or user account.
- Eliminate Manual Effort: Skip the repetitive task of configuring the same settings for every user on the same project.
- Ensure Consistency: Guarantee that all team members are using the same DICOM router configurations, report settings, and table views.
- Rapid Deployment: Quickly apply complex PDF report configurations or PACS settings to new accounts instantly.
When preparing a configuration package, you can toggle the following options to be included in your export:
- Attributes: Core data field definitions.
- Report Settings: General preferences for how reports are generated and displayed.
- DICOM Router Config: Technical routing rules for the Picture Archiving and Communication System.
- Echoloader Settings: Specific configurations for upload tools.
- PACS Config: Connection and communication settings for the Picture Archiving and Communication System.
- Date/Time Settings: Localized formatting for timestamps and scheduling.
- Notifications: Alert preferences and communication triggers.
- Table Settings: Custom column views, sorting, and filtering layouts.
- Fields used to group study visits: Logic and specific fields used to organize patient visit data.
Step 1: Export Your Configuration
- Navigate to the Export/Import Settings icon.
- Toggle on the specific components you wish to include in your export (e.g., DICOM Router Config, Report Settings, or Table Settings).
- Click Export as JSON to generate and download a JSON file containing your settings.
Step 2: Create and Share Template
To apply these settings to multiple users at once:
- Navigate to the Template tab.
- Click the + (plus) sign to add a new template.
- Enter a Name for the template (adding a description is optional).
- Drag and drop your exported JSON file into the designated box.
- Click Save to finalize.
- Use the Manage Permissions option to share this template with other administrators or team members so they can access it.
Step 3: Apply the Settings
You have two flexible options for deploying your new configuration:
Best for standardizing settings across a whole team.
- Go to the Subscription tab.
- Locate the User Setting Template section.
- Find your newly created template in the list.
- Check the box next to the template name.
- Result: The settings are immediately applied to all new users within this subscription group.
- Switch on the toggle labeled "Apply template to all existing users in this subscription".
- Result: The configuration is immediately applied to every user in this group.
Best for unique user setups.
- Go to the User tab and locate the specific user.
- Click the Export/Import Settings icon (double arrows).
- Select the Import Settings tab.
- Choose Import from File.
- Drag and drop the JSON file into the box and click Close.
- Result: The settings are applied only to that specific user.
5.9.6 Subscription User Management Settings
- Existing users: Admin on this subscription can view and manage all users already added to this subscription group. Includes access to user lists, activity, and basic management (e.g., editing roles or disabling). Does not grant visibility to users outside this subscription or non-admin roles.
- Guest user visibility and permissions: Guest users are just a shared contact list for this subscription, not actual licensed users. Admin on this subscription can see the guest users that are added. Guest users do not receive roles, access rights, or license entitlements from this subscription; they cannot log in or use features solely by being listed here.
- Disable unused users: Auto-disable inactive users. Automatically suspend user accounts after this many days without login activity (enter 0 to never disable).
- Concurrent sessions limit: Max concurrent logins per user. Restrict users to this number of active sessions at once (enter 0 allows unlimited).
5.10 Sign Out
Upon completion of your session, you may click on your username and select ‘Log-Out’ to sign out from the ViewPoint EchoPilot software.
6 Performance Summary
The automated analysis generated by ViewPoint EchoPilot will be compared head-to-head against manual analysis (of the same patient data and the same images) generated by trained echocardiography technicians or cardiologists, both in “gold standard” reference echo core labs and “real world” clinical settings. Test datasets are strictly segregated from algorithm training datasets, as they are from completely separate cohorts. Two statistical metrics, Root Mean Square Error (RMSE) and Intraclass Correlation Coefficient (ICC) are used to evaluate the performance of the ViewPoint EchoPilot measurements against expert human measurements.
DICOM images from a wide variety of manufacturers were used to validate the software. DICOM metatag data available in these files contained the following manufacturer and models for the respective versions of our software:
DICOM images used for validation were captured with a variety of convex, linear and phased array probes showing an acquired frequency ranging between 1.4-10 MHz, and a Frames Per Second (FPS) range of 7- 209, with a mean of 31 from the following models, when information was available in the DICOM tags:
6.1 ViewPoint EchoPilot
6.2 Supplementary Cardiac Amyloidosis AI module
The supplementary Cardiac Amyloidosis AI module was developed using a training dataset comprising 4,371 patients and externally validated on an independent pooled dataset of 1,647 patients. The training and external validation datasets were sourced from entirely separate data providers, ensuring no overlap and maintaining full independence between development and evaluation. The external validation cohort included a demographically and geographically diverse population, collected from six clinical sites across the United States and Japan. All echocardiographic studies were retrospectively obtained from routine clinical evaluations and provided in standard DICOM format. Ultrasound data were obtained from GE, Philips, and Siemens systems to train the machine learning-based software device, but the testing data were only obtained from GE and Philips systems.
When tested on a total of 1647 patients, Us2.ca was able to generate a confident prediction for 1434 patients (CA group: 574 patients; Controls group: 860 patients), in which it performed with a sensitivity of 86.9% (95% CI: 84.2%-89.7%) and Specificity of 87.4% (95% CI: 85.2%-89.7%). The overall yield, which refers to the proportion of total tested patients for whom the device was able to generate a confident prediction, is sufficiently high at 87.1%.
The outcomes of the subgroup analysis are provided in the following breakdown,
Stratified by Age
| Subgroup | Primary | Analyses |
|---|---|---|
| Age | Sensitivity (%) (95% CI) | Specificity (%) (95% CI) |
| < 65 years | 78.02 (69.51, 86.53) | 88.63 (85.27, 91.99) |
| >= 65 years | 88.7 (85.87, 91.54) | 86.58 (83.63, 89.52) |
Stratified by Gender
| Subgroup | Primary | Analyses |
|---|---|---|
| Gender | Sensitivity (%) (95% CI) | Specificity (%) (95% CI) |
| Female | 85.61 (79.62, 91.59) | 87.83 (84.15, 91.5) |
| Male | 87.41 (84.3, 90.52) | 87.21 (84.43, 89.99) |
Stratified by Race
| Subgroup | Primary | Analyses |
|---|---|---|
| Race | Sensitivity (%) (95% CI) | Specificity (%) (95% CI) |
| Asian | 92.31 (88.13, 96.49) | 85.29 (80.43, 90.15) |
| African American | 85.38 (80.62, 90.13) | 87.5 (83.57, 91.43) |
| Hispanic or Latino | 100 (100, 100) | - |
| White | 83.7 (78.36, 89.03) | 88.73 (85.4, 92.06) |
| Others | 83.33 (53.51, 113.15) | 90.91 (73.92, 100) |
Stratified by Vendor
The supplemantary Cardiac Amyloidsis AI module is externally validated on data from Philips and GE vendors.
| Subgroup | Primary | Analyses |
|---|---|---|
| Vendor | Sensitivity (%) (95% CI) | Specificity (%) (95% CI) |
| Philips | 84.17 (80.58, 87.76) | 88.42 (85.31, 91.54) |
| GE | 93.14 (89.4, 96.89) | 86.41 (83.24, 89.58) |
Stratified by Data Source
| Subgroup | Primary | Analyses |
|---|---|---|
| Data Source | Sensitivity (%) (95% CI) | Specificity (%) (95% CI) |
| Center 1 | 86.55 (82.63, 90.48) | 87.91 (85.25, 90.57) |
| Center 2 | 78.21 (69.04, 87.37) | 92.11 (83.53, 100) |
| Center 3 | 86.27 (76.83, 95.72) | 86.67 (76.73, 96.6) |
| Center 4 | 92.26 (88.05, 96.47) | 85.35 (80.43, 90.28) |
7 Cybersecurity Instructions and Specifications
This software is licensed by GE Healthcare, manufactured by Us2.ai. All cybersecurity specifications will adhere to the requirements set by the manufacturer.
All user access to the ViewPoint EchoPilot app is via browser using HTTPS. Client use is zero footprint, no software or browser extension installation is required. Local DNS can translate the IP of the ViewPoint EchoPilot server to an agreed URL for use on the local network, or ViewPoint EchoPilot can manage DNS & certificate.
- Google chrome/Microsoft Edge
- Screen resolution 1280 x 1024 pixels or more
- Mobile devices & tablets supported
7.1 Application and access control
ViewPoint EchoPilot application can be managed by local IT administrators. Access control mechanisms such as LDAP (Lightweight Directory Access Protocol) and SSO (Single Sign-On) are available to ensure secure and efficient user management. Administrators are encouraged to provide details about their specific requirements and current user administration practices to tailor the access control setup accordingly.
7.1.1 SSO password complexity settings
- Length of 10 characters
- Requires non-print character
- Requires uppercase letters
- Requires lowercase letters
- Requires numbers
7.2 Physical security
All cloud systems are maintained in AWS datacenters where they have been independently reviewed for physical security and compliance.
Physical security for on-premises solutions is the responsibility of the customer.
7.3 Firmware/Software
The ViewPoint EchoPilot application is hosted on the AWS platform and therefore implements AWS WAFv2 on all our cloud endpoints. Additionally, Crowdstrike Falcon is seamlessly deployed on the ViewPoint EchoPilot system, serving as a robust security solution with advanced anti-virus, anti-malware, and anti-ransomware features, ensuring real-time threat detection and response capabilities.
Software deployed to cloud servers is done by taking a hash of the code and deploying only code that matches the hash. All code is hosted in a private code repository where a complete record of code changes is kept and only authorized users can make changes.
7.4 Privacy and Security
The ViewPoint EchoPilot DICOM router prioritizes data security throughout the communication process. All communication between the router and the ViewPoint EchoPilot cloud is encrypted using the industry-standard 256 AES encryption over HTTPS. Additionally, any data exchanged with the ViewPoint EchoPilot platform itself benefits from encryption with a minimum TLSv1.2 protocol, ensuring your information remains secure at every step.
DICOM TLS is also available to encrypt local traffic on the user network (between the echo scanners and the DICOM router) where required - please contact your ViewPoint EchoPilot representative to enable this feature.
Local hard drives can be encrypted. Updates and antivirus can be deployed in accordance with local IT policies. After testing, certain folders and processes may need to be excluded to optimize performance.
7.5 Logging and alerting
All traffic and changes within our cloud platform is logged. These logs are scanned with compliance rules provided by our cloud provider (AWS). These services include: Control Tower Guard Rails, AWS Guard Duty, AWS Security Hub, Security Hub HIPAA compliance, Security Hub Best Practices. The manufacturer’s operations maintains a 24 hour SLA on investigation and classification of all cloud platform alerts.
7.6 Maintenance of Cybersecurity on devices
The manufacturer constantly monitors and periodically performs both internal and external scans on all devices.
Internal Operating systems and infrastructure patches/upgrades are periodically evaluated, reviewed and tested in our test environment prior to deployment. Any patches to be installed will be scheduled for off-peak hours so as to minimize any business disruptions.
For information regarding our Information Security credentials and current cybersecurity posture, please contact your local representative.
7.7 Updates to software
Whenever there is a software update, our dedicated local representative will proactively communicate with you to provide details on the upcoming release.
7.7.1 Cloud update
Users logging in for the first time after each update will also receive a notification through a "Latest Release" pop-up window. It includes detailed descriptions of the new features introduced in the most recent update, ensuring users are well-informed of the changes made to the software.

You may verify the software version that you are using by hovering over the ViewPoint EchoPilot icon on the top left hand corner. Alternatively, you may also access the release notes in the application settings under the ‘Subscription’ section by clicking on the release version.
7.7.2 On-premises update
Remote installation of the ViewPoint EchoPilot software package is included in the quotation.
When installed on customer owned VM or hardware, the customer takes full responsibility for hardware support, OS installation, patching, security and access control.
7.8 Backups and redundancy
Image data can be backed up in line with local IT policies.
7.9 Vulnerability Reporting
In the event that you notice a security vulnerability, please report it to [email protected] and the manufacturer.
7.10 End of Service data handling
Upon the expiration or termination of your ViewPoint EchoPilot subscription, your account will enter a standard 30-day grace period (or as otherwise specified in your Service Agreement). During this interval, your data remains securely archived but accessible should you choose to renew your services.
Following the conclusion of this grace period, or upon a formal request for immediate removal, GE Healthcare performs a permanent and irreversible disposal of all customer data hosted on our AWS S3 infrastructure. To ensure data integrity and security during this process, we employ the following safety protocols:
Cloud-Based Subscriptions (SaaS) Upon account termination, a 30-day grace period applies, after which data is permanently purged from AWS S3 infrastructure. To ensure secure disposal, GE Healthcare utilizes programmatic deletion and version purging in alignment with NIST 800-88 standards for media sanitization. Immediate removal may be requested in writing; however, once initiated, data is unrecoverable.
On-Premises Deployments For on-premises installations, the purchasing institution maintains exclusive responsibility for data destruction. All retention and disposal activities must be executed according to the customer's internal IT governance and local regulatory requirements.
Warning: Once the disposal process is finalized, data cannot be recovered.
8 Manufacturer info
This software was manufactured in 2026 by Eko.ai Pte Ltd (dba Us2.ai).
Singapore
163 Tras Street, 09-04
Lian Huat building
Singapore 079024
9 Printed user guide
Users can request a printed version of the user guide anytime by sending a request to
[email protected]. The document is free and will be delivered within 7 calendar days.
Revision History
| Revision | Change Description | Date |
|---|---|---|
| A | Initial Release | 28 Jul 2025 |
| B | 1. Update in the manufacturer’s address 2. Update in screenshots to reflect latest software platform 3. Added Product Information page | 12 Aug 2025 |
| C | Updated UDI to include UDI PI portion | 30 Jan 2026 |
| D | Updated to reflect features in v2(.3.0) | 24 Mar 2026 |
| E | Updated to reflect features in v2(.4.0) | 24 Apr 2026 |